Sorting out an Australian three-phase installation

So… We had a flicker around 17:40

You can see in this graph that Phase 1 goes away for a bit and that coincides with the voltage drop.

I have mapped the 3 phases out. The power spike is the aircon (3 phase) and hot water unit (Mains3) firing up.

While we get a flicker in the lights, I don’t think we lose power for anything more than a fraction of a second. I am suspicious that the other Mains Phases read as a undulating flat line…

VV[quote=“bluetardis, post:27, topic:248”]
So… We had a flicker around 17:40
[/quote]

Define flicker. The IoTaWatt shows an outage for ten minutes. If your lights were on during that time, IoTaWatt could not find a symmetrical AC cycle to use as reference. In any event, it logged zero (I believe on all phases, those lines are just the graph utility filling in the gap with the last known value.

So the changes to the sample routines are now picking up the problem and handling it as best it can. I don’t believe this is related to your problem of not matching the meter.

I think I’ve said before that there are a lot of different combinations of phase assignment and CT orientation. I think it’s 48. So there are 47 different erroneous combinations, and 1 correct one. If you have all of the CTs oriented the same way, that reduces the possibilities to 12. If you are certain which line has the VT, the possibilities are further reduced to 4. 3 incorrect and 1 correct. So lets take a look at that old picture of the back of your panel. I’ve marked it up with some labels that I believe are correct:


I’m not sure if this is still the way you have the CTs. The picture is from August 4. I’ve added arrows to each of the Line and Load cables that go to the fuses. Assuming an arbitrary direction of into each fuse, it goes through the fuse, then out the load cable to the meter. So the CT labels on Line A and Line B both face the board. Lets go with that. Now, looking at the CT that you have placed on Load C, the label also faces the board, yet the arrows on the load side point away from the board. So I would say that the CT in the picture on Load C is backwards. Going by the same logic, the CT on Solar is also backwards, but by convention, we usually want the solar generation to be positive, so to get a positive number when current flows backward through that line to the fuse, you should leave the CT backward as is.

Now this is going to change the measurements, exactly how I can’t say. Also, it’s possible that the phases are not correctly assigned. Thinking this through, and my head is starting to hurt because this is not my area of expertise, but remember that I said that if all of the CTs are oriented the same way, and we absolutely know which one is the VT line - phase A (by definition), then there are just four possibilities:

  1. The correct one.
  2. The inputs are assigned to the correct phases but all of the CTs are reversed.
  3. The inputs assigned to phase B and C are reversed and all of the CTs are correctly oriented.
  4. The inputs assigned to phase B and C are reversed and all of the CTs are backwards.

I’m not sure if any of our previous observations can eliminate any of these possibilities, but until that line C CT joins it’s mates with the same orientation, there are a lot more possibilities. So what needs to happen is to insure that all the CTs are oriented the same, and we’ll proceed from there.

Thanks for the detailed approach - lets work through it

Define flicker

The lights (which are multiple 5W LEDs eg x4 or x6 (equal to 100W old style bulb) flicker for a fraction of a second. That said its enough to make a Sony Playstation 3 reboot or if it was off start up. Normally we get about 3 over a 30 minute period.

I haven’t ruled out the air con pulling a lot of power and browning out as it seems to ok when both aircon and hot water are running (all which use PhaseA) but I suspect its the main circuit coming in.

If you are certain which line has the VT, the possibilities are further reduced to 4. 3 incorrect and 1 correct. So lets take a look at that old picture of the back of your panel. I’ve marked it up with some labels that I believe are correct:

The picture is current state and I am 100% positive that the CTs for the Main Phase inputs (Line A,B,C) are oriented the same way. I take your point re load vs line so we should look to move it. Alternatively I can move A and B so we get loads vs lines which might be more consistent.

My plan is to hold off at this point as its now dark outside and I just had tried the sauna for the first time.

Plan Step 1.
I am going to disable all other circuits and get you a shot of IotaWatt with the dryer operating plugged into the same power point as the VT so we can start with that.

I think we should also get the Mains CTs on LOAD for each rather than line but I will await your advise.

I really appreciate the input and will check the board / todo list methodically tomorrow and will report.

I spent quite a bit of time putting together that annotated picture, explaining the reasoning, and presenting a way forward. If you are 100% positive your orientation is nevertheless correct and want to do something else, I cant help you any further. Best of luck.

Please don’t jump to conclusions - I was tired when I wrote that but lets break it down.

The picture is current state and I am 100% positive that the CTs for the Main Phase inputs (Line A,B,C) are oriented the same way. I take your point re load vs line so we should look to move it. Alternatively I can move A and B so we get loads vs lines which might be more consistent.

This is a badly worded question on my behalf. So lets fix that.
The picture / labelling is great and its a useful reference point going forward.

As can be seen in the picture the CTs for the Main Phase Inputs (A/B/C) are all oriented the same way and of that I am sure. I never said that this was the correct way.

My query came from the good point you made of line vs load.
Mains A and Mains B are plugged into the LINE and Mains C is plugged into the LOAD.
This means that one set is wrong and I am assuming its line C you wanted me to move but it wasn’t clear to me last night as the other option was moving A and B over to LOAD so that everything was consistent.

I think my next steps are:

  1. Shut down other house/3 phase power users 3 phase and run a load to confirm the phase that the VT is plugged into and take a screen shot.

  2. Reverse the CT for the Mains 3.

I have done the following and await further suggestions.

  1. Re read and applied your directions above and referenced this thread.
  2. Moved the CT direction on Mains 3
  3. Turned off the big 3 phase consumers at the breakers (Aircon/Shed/Garage)
  4. Run the VT / Circuit test with hair dryer (results below).
  5. enabled the hot water (its now showing backwards which I can fix later but I think pf is good…)
  6. I am still logging at 10:00 and capturing stats

Please let me know what you want me to do next.

Again thanks for all your help.

Reference Screenshots:

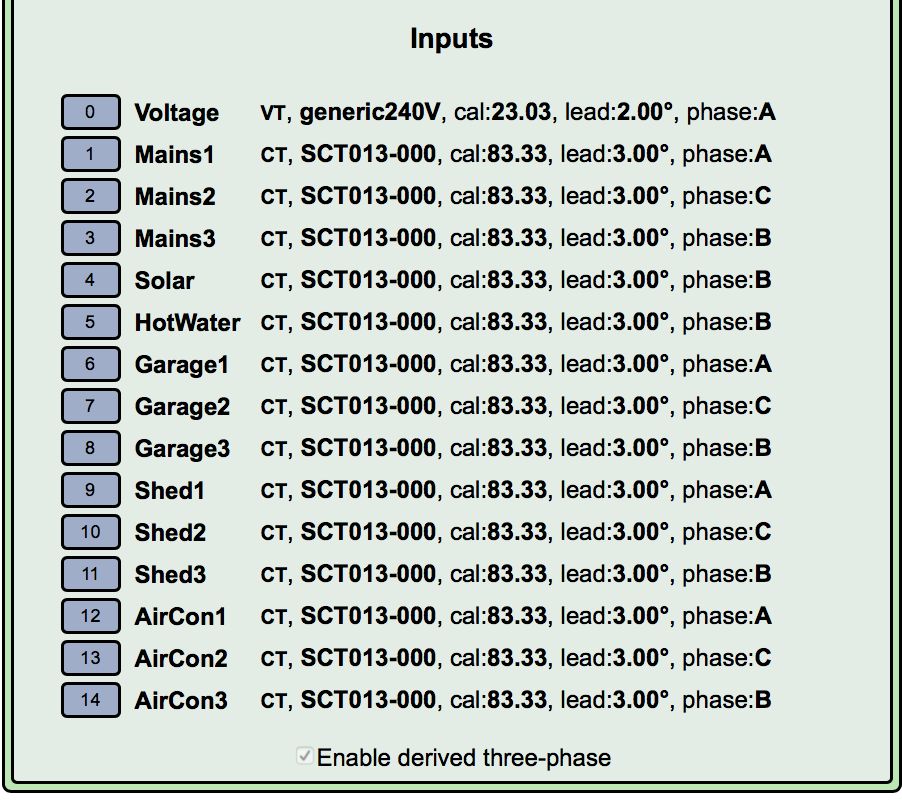
IotaWatt Input configuration

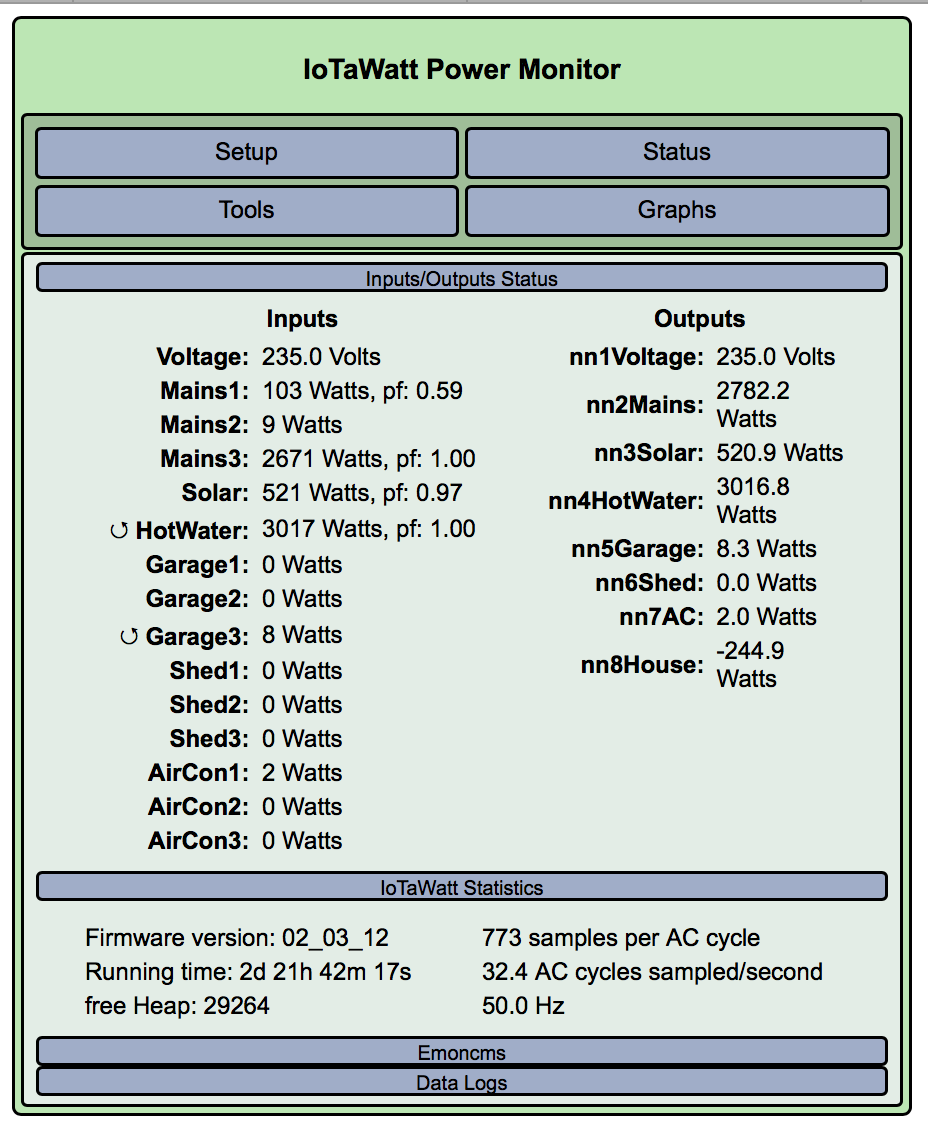
With 1300W Hair Dryer on same power point as VT

The 8w load on Mains 2 are the internal house lights (it goes away if I turn off the breaker)

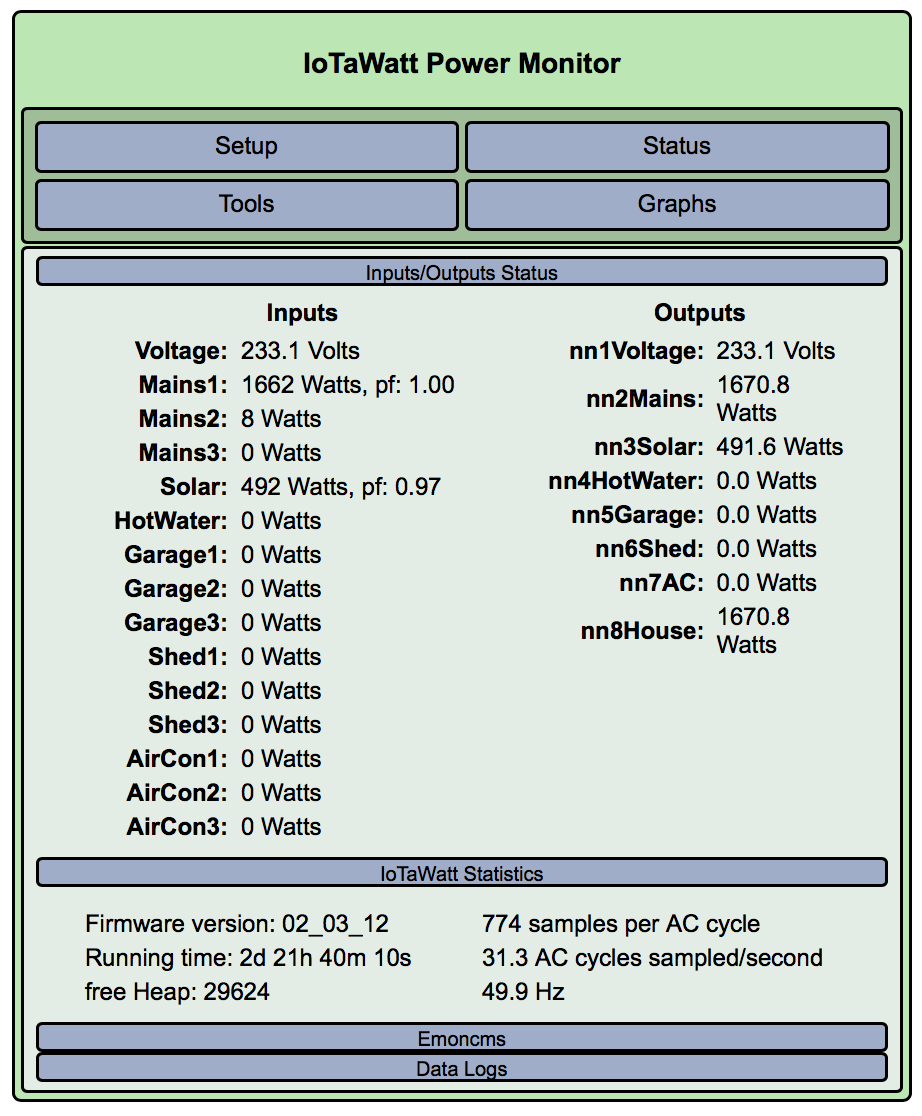
With Hot Water Heater on and hair dryer off
I will figure out Garage3 Later… Its breaker is off.

OK, here’s what concerns me now:

  1. The water heater is showing as 3017 watts, yet the main that feeds it only shows 2671 watts. I think the phase is correct as indicated by the power factor being unity, so I’m questioning the CTs. Obviously the CT on the water heater is reversed, but I don’t think that should be a problem. Here’s what I’d like to do:

a) examine the nameplate of the water heater (a picture would be best). I’m looking for the watts and voltage specification. If it has multiple elements, try to get all of the information on each element.

b) exchange the CTs currently being used for Mains3 and the HotWater. That is to say physically move the CTs, moving theCT to the other circuit and the plugging them in to the other input. If it is a CT problem, the problem the MAin will become overstated.

c) Install the CT on the HotWater reversed from the present install.

  1. The 1300 watt hair dryer appears to be drawing 1500-1600 watts. I’d like to validate that. If you can put together a few incandescent lightbulbs (remember those?) and plug them into the Mains1 circuit, noting the total wattage of the bulbs and the differential as you switch them on and off.

Lets see where this leads.

a) examine the nameplate of the water heater (a picture would be best). I’m looking for the watts and voltage specification. If it has multiple elements, try to get all of the information on each element.

HWS - Solar component Stats
This is the solar component of the of the hot water service…
I have included it for completeness but will need a second body to help troubleshoot/trace the wiring as I don’t know how its actually powered and that will be a voyage of discovery.
I can see a line from the the HWS Circuit breaker on the Main board to an external power point with 2 sockets and both the HWS unit and the roof are connected to it but it does continue to make power even with the HWS circuit breaker off. Previous owner only used to switch it on the HWS Booster circuit breaker during winter to save costs.

**

HWS - Booster Stats
This is the one we need to look at and what kicks in to boost as needed.

b) exchange the CTs currently being used for Mains3 and the HotWater. That is to say physically move the CTs, moving theCT to the other circuit and the plugging them in to the other input. If it is a CT problem, the problem the MAin will become overstated.
c) Install the CT on the HotWater reversed from the present install.

Method.
-removed both CTs from wiring
-swapped the inputs (3 & 5) on iotawatt
-reconnected as suggested (reversed).
Note: I also disabled solar (isolated at the solar board) as I wanted to see if it was making any difference (as its on the same Mains 3 phase. It made 0 difference).

Updated Screenshot after CTs between Mains 3 and HWS moved:

The 1300 watt hair dryer appears to be drawing 1500-1600 watts. I’d like to validate that. If you can put together a few incandescent lightbulbs (remember those?) and plug them into the Mains1 circuit, noting the total wattage of the bulbs and the differential as you switch them on and off.

The hairdryer stats I think we should take with a grain of salt. I did some googling on this which is the model “babyliss super turbo 2800” and got stats back from 1300-2000W with most of them stating 2,000w even though the original paperwork said 1300. While its probably a good load test to see if we have phase correct, its probably not useful for accurate measurement of watts.

Lighting options.
Your suggestion might This may take a little time as I need to find some incandescent bulbs and work out a method to get them into the Mains1 circuit as the lights are on a different circuit/phase.

I do have a portable floodlight which should do the trick - its got an incandescent 150W bulb and a standard aussie power point so I can move it around.
Question - can I use the 150W portable floodlight and get you before/after shots?

I like that the Mains3 is now more than the HotWater heater, but the nameplate on the WaterHeater says it should draw 3600W.

That should be fine. Can you try plugging it into various places and switching on/off a few times (leave on for 30 seconds or so then off for same. Then plot your three mains for that time period with 5-10 sec resolution and post.

Thanks.

I like that the Mains3 is now more than the HotWater heater, but the nameplate on the WaterHeater says it should draw 3600W.

Agreed - possibly a bad CT - possibly an older heater - there is another IotaWatt and 10 x SCT-013 coming but at this point I would almost be happy to be done with it and replace them CTs you like/recommend (I know there are some smaller units and as I don’t have large cable and its a bit tight this could be a better option. If we need to go down that path then I am open to it.)

Can you try plugging it into various places and switching on/off a few times (leave on for 30 seconds or so then off for same. Then plot your three mains for that time period with 5-10 sec resolution and post.

This I can do.

Questions:
a) do you want Phase A/B/C Voltage on the same graph or just make graphs with the one phase thats getting the load?

b) Please explain what you want by “5-10 sec resolution”.

I am assuming you want something like this graph but with it marked up so you can see where I have added 150W to each of the circuits?

I am guessing that the Fixed Interval is what we want. It took a bit for that to work as it didn’t always update the graph for me - I had to flick the “missing data” toggle on/off to get it to re-draw.

Not to go off topic but with what I think is a resolution of 5 seconds you can see the typical voltage sag we get n the graph below - its not 0 but around 175v which is a brownout for sure.

They are pretty regular - 5.30pm, 6.30pm, 8.30pm every night - its not the air con as you can see it in use then stop

Yes. Mains1-3 without the voltage.

Center the area of interest using the “<” and “>” buttons at the top left and zoom in with the “+” button. I don’t know what happened with the graph you posted, but the “Fix” and “Limit data interval” boxes are checked and the resolution isn’t very good. Here’s what it might look like:

Most of those spikes are a fishtank heater with an overly sensitive thermostat. Og course you will have three traces.

I should be able to see it without any markup.

Here you go sir.

Method was
a) turn off non essential power to reduce any base load - I cant remove all of Mains A though as we need internet/power/etc but at least it should be relatively constant.
B) test to ensure I had the correct A/B/C then wait a few minutes.

Then (waited to 13:41)
c) Plugged into Mains A for 90 seconds
d) disconnected for 60 seconds while I went to Mains B then rinse and repeat.

Added an additional Graph - Mains 3 - shows 140w for the light when plugged in. That said its rated as 150w. As far as I can see this is consistent on Mains 1 and 2 but harder to show as we have other power on at the moment.

A random shot with many things happening. The mains look good but I have no idea what is using that much power in the house…unless the mains is reading way high.

That said things aren’t 100% looking at the pf
There is another unit/CTs on its way and once we are happy with the mains I will start connecting the others up. At least that way we will have measured feeds vs the calculated one so I can do some detective work.

&That was productive. It looks now as if the mains are correct. That said, I think the other circuits are still pretty much scrambled with respect to phase assignment and/or CT orientation. At a minimum I would expect the AC to read fairly close on all three phases. Not sure what the load is in the garage, but shouldn’t be reversed and the PF on 1 and 3 are questionable.

One thing that the light experiment shows is that voltage on the three phases is probably not as consistent across the three phases as some other derived reference installations. That is probably why the light is 120/131/139 watts across the three phases. If you want greater accuracy you may want to consider using direct reference after you get the other unit.

In the meantime, you will need to somehow determine the phase for the branches that you have. Can you get a picture of the back of the board where they all connect? Specifically, I’m interested in what’s going on behind this:
image

I will post a photo shortly but most Australian Boards are setup so that there is NO exposed wiring.

My initial thoughts were (and please change/reset if you have a different plan).

a) Create a table that assumes 2 x IotaWatt, lists the IotaWatt inputs, VT or CT, Circuit measured and Phase and CT Orientation.
(I can post this and will get to you amend as you see fit).

b) Other than the 3 phase MAINS, remove the other CTs for now.

c) Run some controlled testing against an unloaded circuit (other than say the 150w light).
Ideally they all measure the same usage within a few watts, but it would be nice to know that the CTs are all reading as expected. I can continue this with the new CTs that should be here in the next day or so.

d) Option 1: If I can get to the back of the board (which I doubt) we can use multimeter/voltmeter to trace circuits.
If this is likely to happen I will get a electrician in to assist but having the table to document in will be invaluable.

d) Option 2: I shutdown power to a minimum (eg MAINS A/B/C and enough for a VT then use my phone to provide WiFi to IotaWatt. Run something on each of the Circuits with a roving CT and see where it pops up (Mains A/B/C) and document the phase that phase is ok.

e) when the new IotaWatt arrives it will have 2 x VTs. (Whats the best way to test them against my current VT or is the plan to go with Phase A and C (as thats most used) and if they read the same we assume B is good?

e) wire up both units/inputs based on what we have learned

f) restart the emoncms.org inputs and feeds and give it a week.

According to the meters we are pretty consistently sitting on 44kw used per day and making about 4kw on a sunny day. Unless we use the Sauna but its rare.

Thoughts/comments/preferred direction>


EDITs added picture
note that largest cable is 6mm so I could get away with a smaller CT

I think this is the next step.

Introducing another IoTaWatt before this one is reconciled would just compound the problems. One thing at a time.

Does this come close to the IoTaWatt Mains total now?

If the mains prove out with the meter, the next step is to sort out the various branch circuits.

Read time for me is 10:00 which is UTC 0.00 so will get both done in about 30 minutes.

I am talking with Tristan from emoncms as the daily feeds (kwhd) went away and they are likely to be reset. I am going to see if I can make a daily feed from Iotawatt using the MAINS total and delta.

That’s way to complicated, and I trust the IoTaWatt datalog more for this anyway. You can get the current kWh to date for any input or output from the graph app. Just run the graph app and click on the desired input or output under the “energy” tab. Here’s my meter:


The max value at the bottom is your present “IoTaWatt Meter” reading. You should record this at the same time as the physical meter reading. There is no time latency. Everything is now.

Thats a much better and more reliable way to do it.
Ideally I would leave it another 24 hours (as we moved CT for Mains 3 yesterday) and it might be good to give it some additional time.

Graph is below. I have left the csv in there so you can see both the Mains and Solar totals.

Actual reads from the meter will go here shortly:
As mentioned, the solar is pretty much accurate.

Date Mains Meter
07/08/2018 27,737 53
08/08/2018 27,790 25
09/08/2018 27,815 54
10/08/2018 27,869 44
11/08/2018 27,913 46
12/08/2018 27,959 76
13/08/2018 28,035 44
14/08/2018 28,079 69

So at present it seem to be under-reading but it might be that with the change to Mains3/C we are now ok. Lets give it another 24 hours.