Sorting out an Australian three-phase installation

Not too clear on that 10:00 check in time, but over a few days, should not matter

EmonCMS calculates dailies and kwhd at GMT which for us is +10 or 10am so by measuring the meter then then I can get dailies that should line up. Once we get agreement between meter and iota watt then this can go away.

Looking at the graph/delta, it appears iota watt does the same and as all my readings were taken at 10:00. This gives me a consistent time (that appears to line up with the software/reporting).

Post the data after you get back on the air.

Here is the data for the last 3 days - this now give us 2 prior days of clean measurement.

I can go further back if needed but didnt think it was useful as we did a stack of testing and changed CTs so its not going to be particularly accurate.

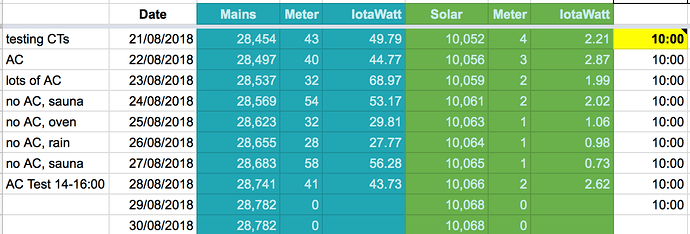
Date Mains Meter IotaWatt Solar Meter IotaWatt
21/08/2018 28,454 43 49.79 10,052 4 2.21
22/08/2018 28,497 40 44.77 10,056 3 2.87
23/08/2018 28,537 32 68.97 10,059 2 1.99

Notes:
a) The meter readings are a bit lower and closer to what I would expect. That said the AC off at the meter for 20 hours a day and Sauna not used so this is basic house+oven+hws etc.

b) CTs are all from the second batch of SCT013-000 100A units that we tested and positioned as discussed.

c) Reading the Solar Watts from the IotaWatt Web Status vs the Digital meter is very close and this now lines up in the meter readings.

d) When measured with load, each phase appears to be correct - our kettle load test when checked on Phase A/B/C shows very similar watts and a pf of 1.0

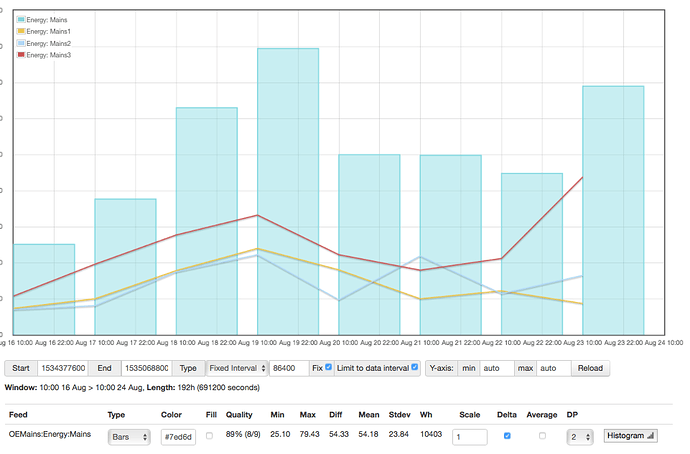
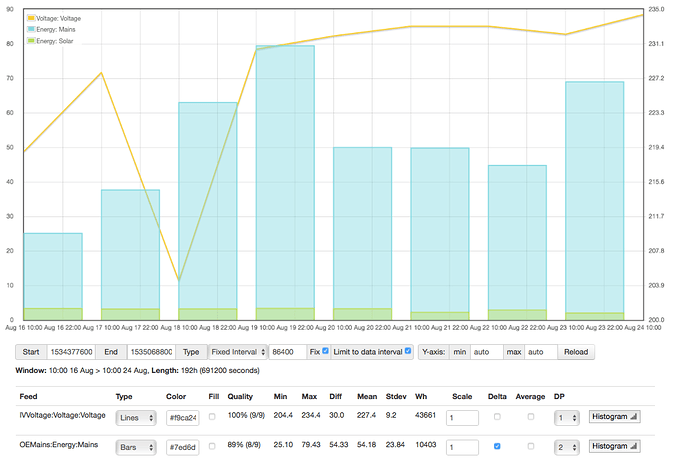
e) The total comes from the Outputs created ā€œMainsā€ of Mains1+Mains2+Mains 3 and then this graph.
The graph uses energy, with a delta and daily to get the totals.
Please advise if this isnā€™t the best way

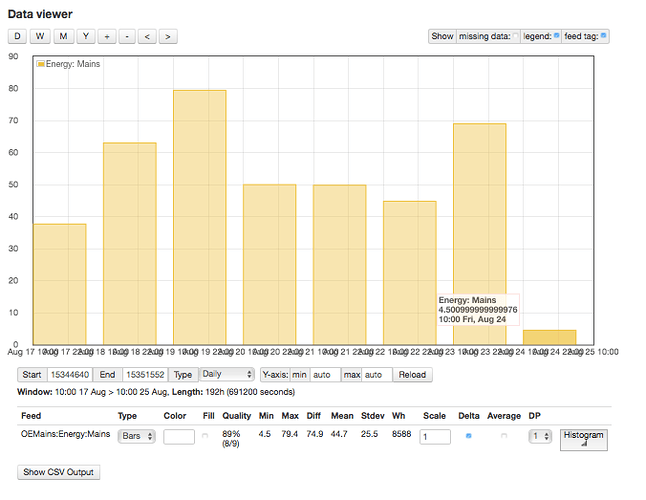
2018-08-16 10:00:00, 219.0, 25.10, 3.31
2018-08-17 10:00:00, 227.9, 37.66, 3.15
2018-08-18 10:00:00, 204.4, 62.98, 3.19
2018-08-19 10:00:00, 230.5, 79.43, 3.35
2018-08-20 10:00:00, 232.0, 49.97, 3.23
2018-08-21 10:00:00, 233.1, 49.79, 2.21
2018-08-22 10:00:00, 233.1, 44.77, 2.87
2018-08-23 10:00:00, 232.2, 68.97, 1.99
2018-08-24 10:00:00, 234.4, null, null

As you can see its reading way high compared to meter.

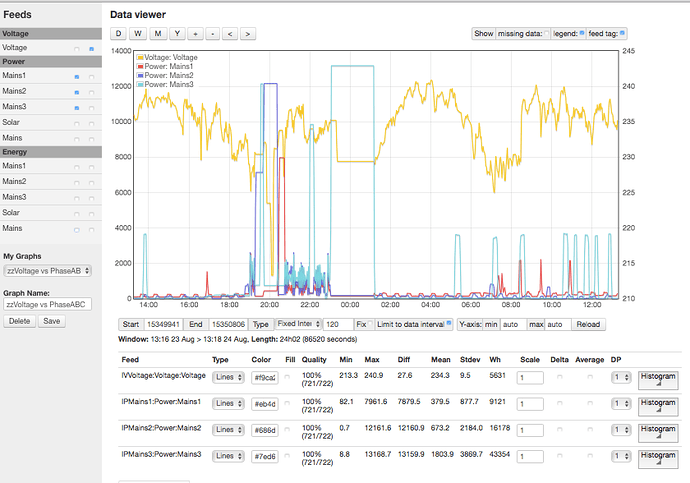
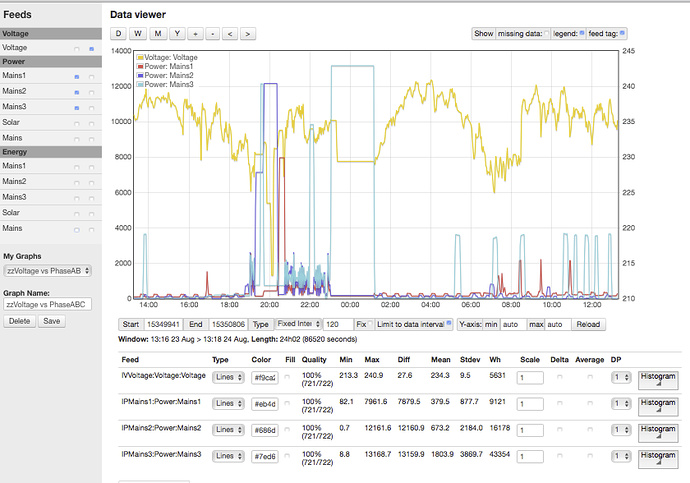
Here is the graph with the table showing the phases if it helps for the same time period. The basic calculation adds up.

2018-08-16 10:00:00, 25.10, 7.34, 7.01, 10.76
2018-08-17 10:00:00, 37.66, 9.99, 8.08, 19.59
2018-08-18 10:00:00, 62.98, 17.81, 17.47, 27.70
2018-08-19 10:00:00, 79.43, 23.99, 22.23, 33.21
2018-08-20 10:00:00, 49.97, 18.02, 9.73, 22.22
2018-08-21 10:00:00, 49.79, 9.98, 21.88, 17.93
2018-08-22 10:00:00, 44.77, 12.19, 11.41, 21.17
2018-08-23 10:00:00, 68.97, 8.67, 16.49, 43.81
2018-08-24 10:00:00, null, null, null, null

Please advise next step.
Iā€™m not too clear on how all that works. When talking accuracy, I prefer to deal with the data directly from IoTaWatt, from which you can get the current kWh reading at any time.

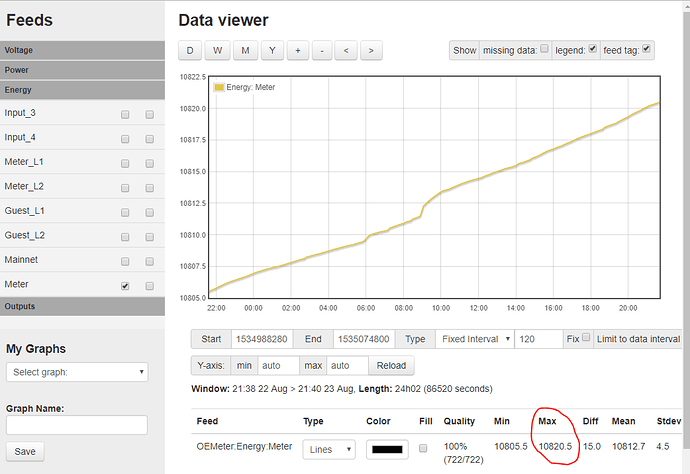
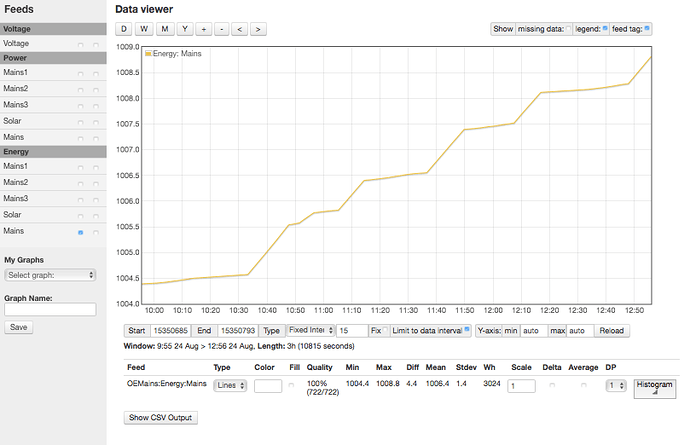
You have an output defined called Mains, which is the sum of the three main inputs. If you run the graph app, and select Mains under the ā€œEnergyā€ tab, you will get the running kWh total for the last 24 hours (or any period you select at the top). Because I am split-phase 120/240 in North America, I have two mains. So I have an output ā€œmeterā€ defined, which is the sum of the two mains:

So right now, my virtual meter reads 10820.5 (You can see by Diff that we used 15 kWh in the last 24 hours). My point is that you can read your IoTaWatt meter anytime you want to. The way I track accuracy, is that I read my physical meter and the IoTaWatt kWh total at the same time. Then a day, or two days, or anytime I think of it, I read the two again. The difference between each should be the same. There is no need to read your meter at a particular time to do this accuracy check. Itā€™s more convenient and there is no doubt about the figures. You can do the same with your solar feed, recording that meter and the Max kWh for your solar under the Energy tab.

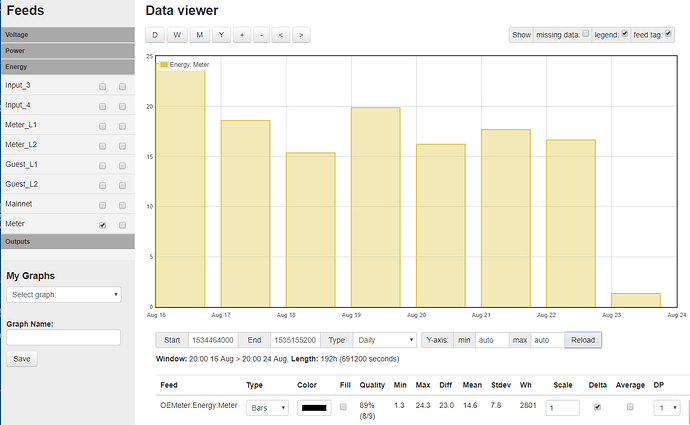
I prefer to work with these numbers, with date and time of each reading. You can use the Emoncms agregate function in your reporting to track daily use if you fing that convenient. You can also get daily use from IoTaWatt:

From the previous graph, I selected Week, Type ā€œDailyā€, In the Feed line I selected Type ā€œBarsā€ and ā€œDeltaā€. Just like Emoncms, you can save this graph to recall anytime. This graph is UTC days, I think thereā€™s a way to make it do your local time zone. The data is certainly available.

But lets start using a log with the IoTaWatt numbers take simultaneously for comparisons.

The way I track accuracy, is that I read my physical meter and the IoTaWatt kWh total at the same time. Then a day, or two days, or anytime I think of it, I read the two again. The difference between each should be the same. There is no need to read your meter at a particular time to do this accuracy check. Itā€™s more convenient and there is no doubt about the figures. You can do the same with your solar feed, recording that meter and the Max kWh for your solar under the Energy tab.

I get this - I have been reading daily at 10 as I am home and its daylight. just a habit to read at the same time so I could compare usage over a time period until we get things sortedā€¦

My method to date was to take readings simultaneously (within a minute of both the meters and iota watt data). As my meters are manual, I had take a photo then gone to the computer, refreshed the graph from iota watt and then entered the data into the spreadsheet before posting here.

I think we are in violent agreement with the Graphs and have posted what you asked for below. The ā€œDeltaā€ method is what as I using as this gave me history. Please tell me if I misinterpreted

I will post more results for tomorrow - I did a quick compare now against my last read (10:00) and both close - e.g. within 10% for both but with only 4kwh on Mains and 1kwh on solar, e.g. IotaWatt vs Meter.

49%20pm

These is consistent with numbers shown for the last few days. Overall power usage a bit simpler/cleaner - vs what happens at night (e.g. last 24 hours here)

I guess Iā€™m looking to simplify the data. Date, time, meter reading, IoTaWatt reading. I donā€™t think 10% is a very good result, and 32 vs 69 on the 23rd is just wrong.

So Iā€™m working about 5 different issues at any time with various people. I realize you read a lot into the data you are collecting, but my attention is only on the relationship between your meter and the IoTaWatt. Iā€™d like to see those simple numbers for a week, and know that it is with 3 SCT013-000 CTs on the mains. No changes. The voltage all over everything is a distraction.

If the IoTaWatt and meter are not much closer, Iā€™ll be looking for something else wrong.

I appreciate the help and can see you have a bit going on - between trouble shooting and education you are doing a great job.

I donā€™t know why we had that outlier. I will keep an eye on what goes on and see if there is something odd - the main difference is that that night the air con had been running.

I will keep on logging - the 3 x main + solar is the only thing connected at present.

I have had an electrician visit briefly. They will return next week to validate the Phases and they also want to check the neutral connection.

Thatā€™s not an outlier, itā€™s a huge red flag. Those kinds of things donā€™t just go away, never to return, and you are reporting 10% variance on the other data point. Something is definitely wrong. Even with incorrect CT configuration, once the phase was straightened out the difference was fairly consistent. At this point, I question whether the CTs were reinstalled with the correct orientation, or even with the correct phase assignments.

I havenā€™t touched anything in the install since we did the testing and reset our inputs/outputs.
The 4 x SCT013-000 are on MainsA/B/C and Solar.

Last 24 hours, no air conditioning running but we did run the Sauna.
Same, saved graph as per always and read at 10:00

Numbers line up for Power and Solar (as close as I think we can expect given my old meters that donā€™t do decimals.) 54 vs 54.17 and 2 vs 2.02

This is encouraging. I will keep on monitoring for a few more days and see what we get. I will note if we use the AirCon.

Why did we get that strange reading. No idea. Nothing had been touched in the box or IotaWatt configuration.
I do know it was >36 hours past the testing we did so it should have been clean data.
The air con had been on a lot for that day. If it is the Aircon doing this, unless my meter is faulty/wiring for AC isnā€™t right it shouldnā€™t make a difference as we are reading MainsA/B/C not the aircon. Its conjecture at this point and I am not going to sweat it. Electrician due next week to check neutrals and confirm phases.

EDITS - fixed the table included to show notes and time.

No changes to setup. Still logging and details below.

We have started testing using the slow combustion fire for heating, so no AirCon for a couple of days. Once I get 3 or 4 days of reads I will start the air con for a few hours and see if we go back to getting a discrepancy. Its also probably that by then we will have an an electrician out to check the meters.

No changes to setup.
No use of AirCon

Logging still tracking nicely.
Plan is to use the sauna tonight so will have bigger numbers tomorrow but I expect Meters to be in line with IotaWatt.

@bluetardis, looking better as I have been following your progress. I am curious about your solar setup if you would not mind sharing, PM if you would like to keep the thread on topic. We will have solar installed on our property in the next few weeks and seeing your solar input and meter info got me wondering. Nice to see the green cell color. It appears you produce about 1/3 of your energy from the sun compared to the mains usage; correct?

Enjoy the sauna!

@quella I am happy to chat and possibly Aussie solar is a good separate topic as this has been devoted to sorting out the overall install.

Quick answers for now:
-our solar is quite old and inherited with property
-itā€™s a 1kva system and makes around 680watts in the middle of winter or 3-4kwhd on a sunny day
-its a single phase install hooked into one of our phases
-without using the aircon or sauna, we are using about 33kwhd and making 3kwhd so 10%

Once I have more information on what uses power and when, I am planning to replace it with a new largersystem, probably with a battery - it will come down to cost/business case. I expect AirCon to be replaced with a 3 phase modern inverter unit vs my old R22 gas beastie.Again I expect Iotawatt will greatly assist with monitoring, planning and management of this.

Drop me a line if you have specific questions.

Notes for Tuesday

  • No Changes to setup
  • No use of aircon
  • Sauna
  • Rain for last few days (low solar read is ok)
  • Electrician coming next Monday morning.
  • 3 x ECS1050 L59E have arrived. Remaining batch expected late this week.

@overeasy I am happy to keep going with this as long as you want but I think its tracking reasonably well. I would like to test using the AirCon for a few hours and see if its what throws out the reading. Please advise.

Yes, it does seem to be tracking pretty consistently for the past 4 days. Looking further at the anomaly on Aug 23, you posted this plot for the day:
image
What glares out at me is an outage between 23:00 and 1:00 where phase 3 is recording 13kW. Thatā€™s a little over 26kWh that seems in error, and there is another issue back around 20:00. So I think that is the explanation for the anomaly, although I have no explanation for why it happened. Apparently it hasnā€™t happened since. I may ask for some data from the datalog to track this down if it recurs.

But the good news is that the IoTaWatt appears to be tracking your main meter by about -2.9%. Thatā€™s not too bad for derived reference. Itā€™s impossible to know if the problem is voltage variation on the two derived phases or calibration of the meter or CTs.

So go ahead and let the AC rip, but please keep the mains log running and post every few days until we see the full effect of the AC.

The Solar looks good, but itā€™s really pretty low power. Thankfully, itā€™s on phase A so itā€™s just like a single phase system.

I will give the Aircon a go later today (Its been off at the breakers last 4 days).

I have a hunch that that something happens in one of the air con circuits when it fully powers on and that upsets the VT and we lose readings. Anytime we get a massive high reading its been its Mains3 (Phase B). Will let you know what happens once the electrician has had a look at it.

Mains3/PhaseB also has the Solar and Hot Water but they read/track fine if the AirCon isnā€™t usedā€¦

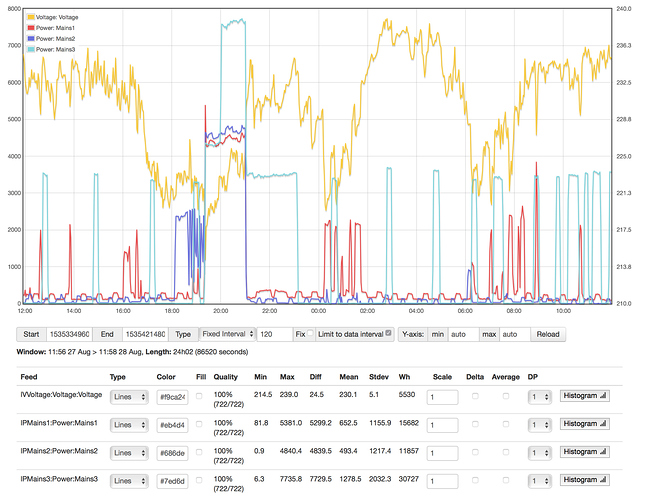
Hereā€™s the above graph for the last 24 hoursā€¦ All seems good.
The Mains 3 spikes are Hot water. The Mains 1/2/3 at around 20:00 are the sauna then the hot water as 4 people had a shower.

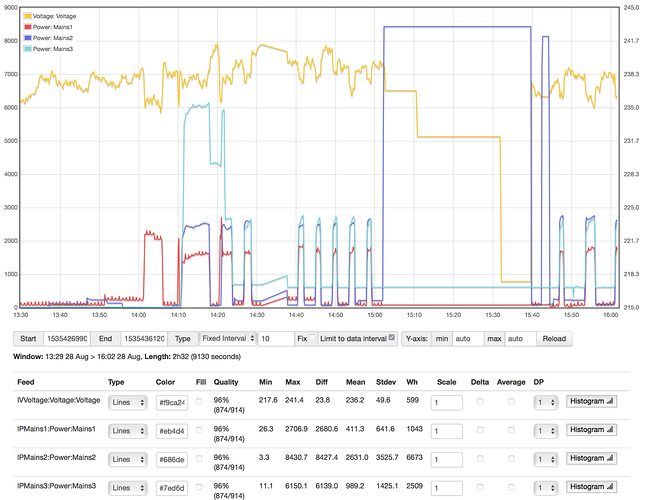
@overeasy I have some new data for you. I donā€™t have all the answers but I have a reproducible test that helps explain some thingsā€¦

Steps:

  • Ran the aircon (heating cycle) from just after 14:00 today.
  • The aircon seemed to cycle ok then kind of went into a standby around 15:00.
  • As you can see readings got stuck. A little different this time (Mains2 vs Mains3)
  • If it was staying this high then thats why we got significantly higher totals vs the meter.

I had to end up power cycling the Iotawatt to get back online (around 16:00).
Longer story but we had to drop power to Circuit 2 (which includes the Wifi and the IotaWatt lost connection) but it came came straight back up.

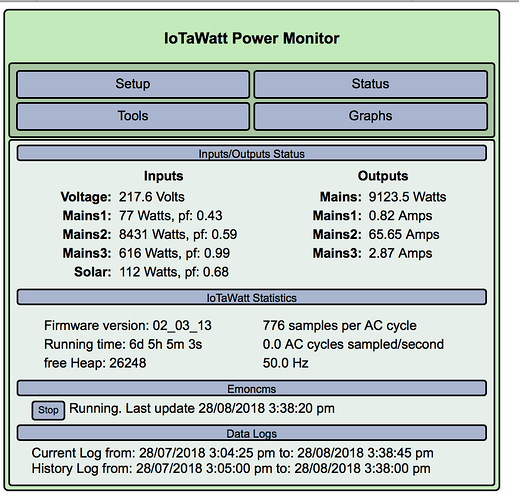
IotaWatt Status/web interface was accessible and reporting during this time:

Normality restored.
An hour or so later, still showing the period of interestā€¦ Mains2 is the Oven prepping for a Roast Dinner but thats a normal read.

I am awaiting instruction but I guess you want me to run it again with the laptop logging the serial capture.

That might be helpful.

@overeasy I will get this done today and will post the log file.Please let me if you want me to use a different method other than below.

Assumed method:

  1. aiming for a 2-3 hour elapsed timeframe
  2. laptop plugged in and reboot
  3. 30 mins or so for baseline prior data
  4. enable AC Air Con on unit we get a ā€œflatlineā€
  5. interrupt the flatline after 30 mins or so
  6. 30 mins or so for baseline post data
  7. graph with voltage/phase a/b/c zoomed in to interesting period

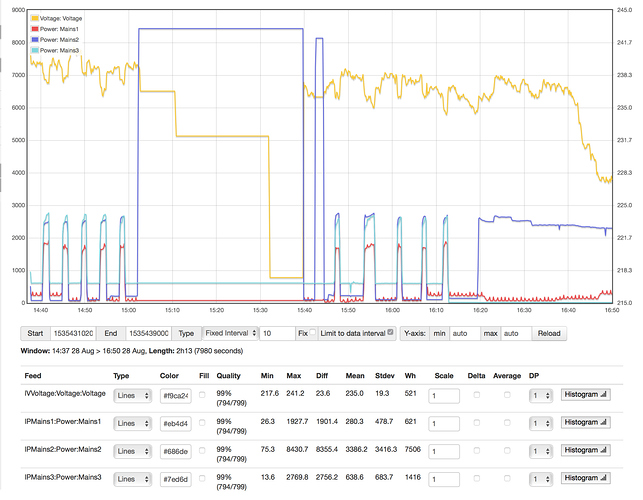
In the meantime here is the graph. Mains is higher than meter (as expected). Its only a little higher as we only had a ā€œflatlineā€ high for 40 minutes vs 8+ hours.

Thatā€™s fine. Donā€™t need/want the voltage on the graph. Itā€™s a distraction.

I think I know whatā€™s going on in the IoTaWatt, just donā€™t understand how that can happen. I suspect that the AC introduces some kind of asymmetry in the voltage wave. Getting outside my comfort zone here, but I think we established that the AC appears to have some single phase motors, probably on the air-handler, with a three phase compressor. But Iā€™m also curious because itā€™s winter there and you are using it for heating. So is it a heat-pump or does it have resistance heaters or both?

Thatā€™s fine. Donā€™t need/want the voltage on the graph. Itā€™s a distraction.

No problem - I have made/saved a new graph without the Voltage on it.

I think I know whatā€™s going on in the IoTaWatt, just donā€™t understand how that can happen

Thats excellent news. I will have more information shortly.

I suspect that the AC introduces some kind of asymmetry in the voltage wave. Getting outside my comfort zone here, but I think we established that the AC appears to have some single phase motors, probably on the air-handler, with a three phase compressor. But Iā€™m also curious because itā€™s winter there and you are using it for heating. So is it a heat-pump or does it have resistance heaters or both?

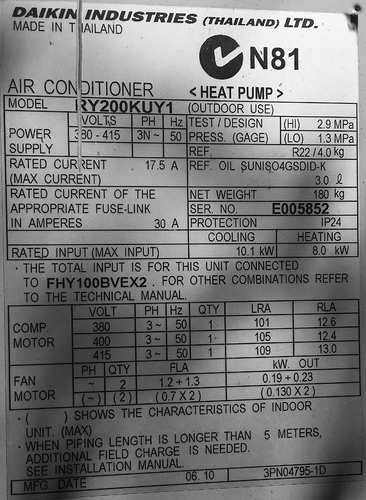
The AC has a heat pump. Its about 9 years old and uses (for australia) old gas and isnā€™t super efficient.
Happy to find/link specs as needed but as an example, the electrician who came originally pointed out that its running and pulling 6-8k whereas the same, modern unit with inverter (3 phase/whole house/vented) should top at around 1800w and run more quietly/smoothly.

Its using power across phases for different things. EG standby power vs high and low fans, compressor, heat pump etc and these show across multiple phases.

Best I can find for a manual with specs is belowā€¦
The model is RY200KUY1 and its a big beastie outdoor unit.

http://file.thermotrade.ru/techno/Daikin%202013/Sky/ļæ½ļæ½ļæ½ļæ½ļæ½ļæ½ļæ½ļæ½ļæ½/FD-K/FD08-15K_service%20manual_en.pdf

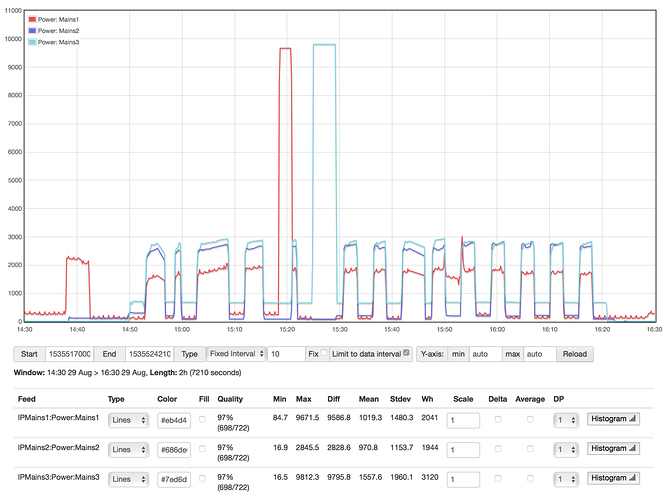
14:40 kettle on for a cup of tea
14:49 aircon circuits on at breakers
14:50 aircon ON (heating on)
15:01 turned up to 24degrees (celcius)
16:20 airconn OFF
16:22 aircon circuits off at breakers

graph attached
log attached (this is the .txt output from direct attached serial port)
screen
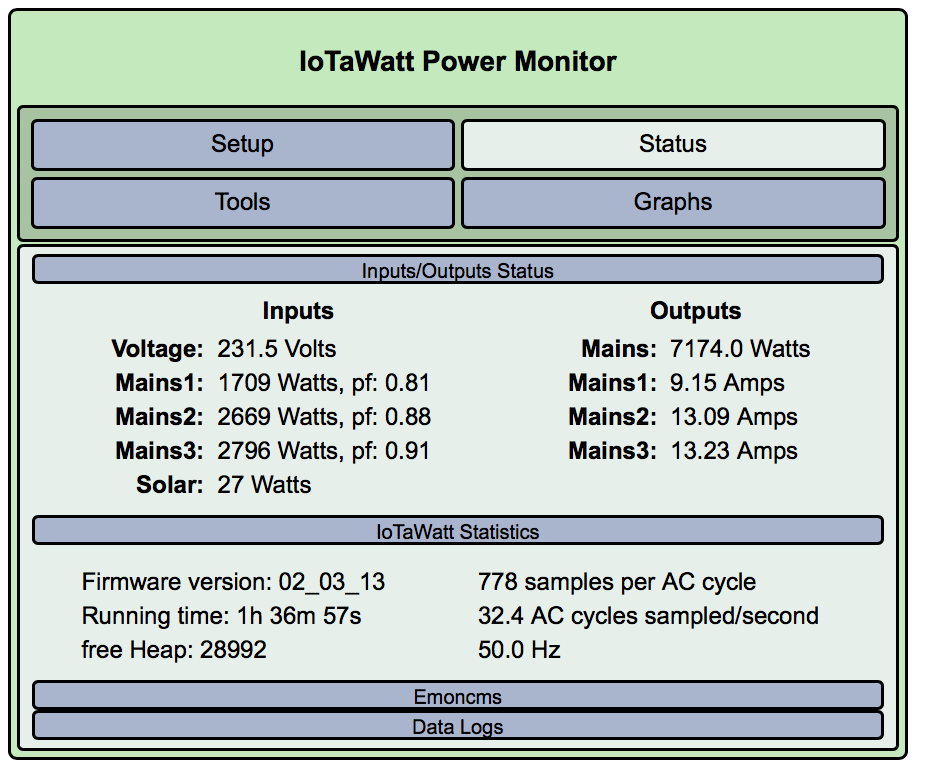
status screenshot (for that much wattage on any other circuit I get 1.0 pf)

Mains3 is the fan which seems to be always on.

screenlog.0.txt (1.6 KB)