Uploading to InfluxDB

It’s been a year since I’ve had any real issues with my IotaWatt. It’s just been humming along like nobody’s business. The few issues I’ve had were easily solved by deleting data from the InfluxDB and resending it via the uploader. However, I have run in to an issue where this is not working. I’ve attached a screen shot of the InfluxDB graph and it appears to be missing several days worth of data. I’ve tried 3 times to delete all of the 2024 data from the database and let the uploader resend it. I’ve gotten the same results every time. I’ve also included a screen shot of the graph+ data straight from IotaWatt. It’s definitely showing data but appears to not be uploading correctly. When the 2024 data starts uploading, I get a lot of “post failed -11” errors. It also seems odd that the sum on the graoph+ and the total WattHtrs on the InfluxDB seem to agree even though there appears to be 5 or so days of data missing. Any thoughts?

Dave


http code -11 is a timeout. Most likely no response from the influx server.

I don’t have enough information to answer the rest of your questions. I could use the message log from when you attempted the history upload. I suspect the answer to why influx and the IoTaWatt are reporting the same Wh has to do with Wh (or Watts if you are integrating) being successfully uploaded while Amps are not. The Grafana dashboard is showing amps while the IoTaWatt Graph+ is plotting Watts. Your basic apples and oranges.

Here is the message log.

9/25/23 21:04:32z Trace: 1:3, 1:3, 1:6[1], 1:6[2], 1:6[3], 1:5[31], 1:6[4], 31:0, 31:1, 31:2[3], 32:60, 31:1, 1:6[6], 1:1[10], 1:2[11], 9:0[11], 9:0, 9:1, 8:4, 8:6, 8:8, 9:3, 9:5, 9:9, 1:3, 1:3, 1:6[1], 1:6[3], 1:5[5], 1:6[4], 5:0, 5:7
9/25/23 21:04:32z ESP8266 ID: 6195317, RTC PCF8523 (68)
9/25/23 21:04:32z IoTaWatt 5.0, Firmware version 02_08_03
9/25/23 21:04:32z Updater: Installing update files for version 02_08_03
9/25/23 21:04:32z Updater: Installing FAVICON.ICO
9/25/23 21:04:32z Updater: Installing GRAPH.HTM
9/25/23 21:04:32z Updater: Installing GRAPH.JS
9/25/23 21:04:32z Updater: Installing GRAPH2.HTM
9/25/23 21:04:33z Updater: Installing GRAPH2.JS
9/25/23 21:04:33z Updater: Installing INDEX.HTM
9/25/23 21:04:34z Updater: Installing TABLES.TXT
9/25/23 21:04:34z Updater: Installing CNFSTYLE.CSS
9/25/23 21:04:34z Updater: Installing EDIT.HTM
9/25/23 21:04:34z Updater: Installation complete.
9/25/23 21:04:34z SPIFFS mounted.
9/25/23 17:04:34 Local time zone: -5:00, using DST/BST when in effect.
9/25/23 17:04:34 device name: IotaWatt
9/25/23 17:04:34 HTTP server started
9/25/23 17:04:34 influxDB_v1: Starting, interval:5, url:http://192.168.1.240:8086
9/25/23 17:04:34 timeSync: service started.
9/25/23 17:04:34 statService: started.
9/25/23 17:04:35 dataLog: service started.
9/25/23 17:04:36 dataLog: Last log entry 09/25/23 17:04:05
9/25/23 17:04:40 historyLog: service started.
9/25/23 17:04:40 historyLog: Last log entry 09/25/23 17:04:00
9/25/23 17:04:40 Updater: service started. Auto-update class is MINOR
9/25/23 17:04:40 WiFi connected. SSID=ATT6AbiV3A, IP=192.168.1.233, channel=6, RSSI -55db
9/25/23 17:04:41 influxDB_v1: Start posting at 09/25/23 17:03:45
9/25/23 17:04:43 Updater: Auto-update is current for class MINOR.
9/28/23 00:51:22 WiFi disconnected.
9/28/23 00:52:34 WiFi connected. SSID=ATT6AbiV3A, IP=192.168.1.233, channel=1, RSSI -66db
9/28/23 01:10:13 Updater: Invalid response from server. HTTPcode: 400
10/03/23 14:51:28 influxDB_v1: stopped, Last post 10/03/23 14:51:20
10/03/23 14:56:08 influxDB_v1: Start posting at 09/29/23 20:00:05
10/03/23 15:45:24 influxDB_v1: stopped, Last post 09/30/23 21:16:00
10/03/23 15:45:38 influxDB_v1: Start posting at 09/30/23 21:16:05
10/21/23 16:16:54 WiFi disconnected.
10/21/23 16:17:50 WiFi connected. SSID=ATT6AbiV3A, IP=192.168.1.233, channel=1, RSSI -61db
10/28/23 11:16:50 Updater: Invalid response from server. HTTPcode: -11
11/06/23 16:20:38 timeSync: Six week routine restart.

** Restart **

SD initialized.
11/06/23 21:20:40z Real Time Clock is running. Unix time 1699305640
11/06/23 21:20:40z Reset reason: Software/System restart
11/06/23 21:20:40z Trace: 1:3, 1:3, 1:3, 1:3, 1:3, 1:3, 1:3, 1:3, 1:3, 1:3, 1:1[2], 1:2[3], 9:0[3], 9:0, 9:1, 8:4, 8:6, 8:8, 9:3, 9:5, 9:9, 1:3, 1:3, 1:6[1], 1:6[2], 1:6[2], 1:6[2], 1:6[3], 1:5[20], 1:6[4], 20:0, 20:1
11/06/23 21:20:40z ESP8266 ID: 6195317, RTC PCF8523 (68)
11/06/23 21:20:40z IoTaWatt 5.0, Firmware version 02_08_03
11/06/23 21:20:40z SPIFFS mounted.
11/06/23 16:20:40 Local time zone: -5:00, using DST/BST when in effect.
11/06/23 16:20:40 device name: IotaWatt
11/06/23 16:20:40 HTTP server started
11/06/23 16:20:40 influxDB_v1: Starting, interval:5, url:http://192.168.1.240:8086
11/06/23 16:20:40 timeSync: service started.
11/06/23 16:20:40 statService: started.
11/06/23 16:20:40 dataLog: service started.
11/06/23 16:20:42 dataLog: Last log entry 11/06/23 16:20:35
11/06/23 16:20:45 historyLog: service started.
11/06/23 16:20:46 historyLog: Last log entry 11/06/23 16:20:00
11/06/23 16:21:49 WiFi connected. SSID=ATT6AbiV3A, IP=192.168.1.233, channel=5, RSSI -60db
11/06/23 16:21:49 Updater: service started. Auto-update class is MINOR
11/06/23 16:21:50 influxDB_v1: Start posting at 11/06/23 16:20:30
11/06/23 16:21:52 Updater: Auto-update is current for class MINOR.
11/07/23 01:21:22 WiFi disconnected.
11/07/23 01:22:58 WiFi connected. SSID=ATT6AbiV3A, IP=192.168.1.233, channel=1, RSSI -58db
11/07/23 01:23:02 Updater: Invalid response from server. HTTPcode: 400
12/05/23 15:25:38 Updater: Invalid response from server. HTTPcode: -11
12/18/23 16:26:08 timeSync: Six week routine restart.

** Restart **

SD initialized.
12/18/23 21:26:09z Real Time Clock is running. Unix time 1702934769
12/18/23 21:26:09z Reset reason: Software/System restart
12/18/23 21:26:09z Trace: 9:9, 1:3, 1:3, 1:3, 1:3, 1:3, 1:3, 1:3, 1:3, 1:3, 1:3, 1:3, 1:3, 1:3, 1:3, 1:3, 1:3, 1:3, 1:3, 1:3, 1:3, 1:3, 1:3, 1:6[1], 1:6[2], 1:6[2], 1:6[2], 1:6[3], 1:5[20], 1:6[4], 20:0, 20:1
12/18/23 21:26:09z ESP8266 ID: 6195317, RTC PCF8523 (68)
12/18/23 21:26:09z IoTaWatt 5.0, Firmware version 02_08_03
12/18/23 21:26:09z SPIFFS mounted.
12/18/23 16:26:09 Local time zone: -5:00, using DST/BST when in effect.
12/18/23 16:26:09 device name: IotaWatt
12/18/23 16:26:09 HTTP server started
12/18/23 16:26:09 influxDB_v1: Starting, interval:5, url:http://192.168.1.240:8086
12/18/23 16:26:09 timeSync: service started.
12/18/23 16:26:09 statService: started.
12/18/23 16:26:09 dataLog: service started.
12/18/23 16:26:12 dataLog: Last log entry 12/18/23 16:26:05
12/18/23 16:26:14 historyLog: service started.
12/18/23 16:26:14 historyLog: Last log entry 12/18/23 16:26:00
12/18/23 16:26:21 WiFi connected. SSID=ATT6AbiV3A, IP=192.168.1.233, channel=4, RSSI -59db
12/18/23 16:26:21 Updater: service started. Auto-update class is MINOR
12/18/23 16:26:22 influxDB_v1: Start posting at 12/18/23 16:25:40
12/18/23 16:26:23 Updater: Auto-update is current for class MINOR.

** Restart **

SD initialized.
12/25/23 13:39:58z Real Time Clock is running. Unix time 1703511598
12/25/23 13:39:58z Reset Reason: Power-fail restart.
12/25/23 13:39:58z ESP8266 ID: 6195317, RTC PCF8523 (68)
12/25/23 13:39:58z IoTaWatt 5.0, Firmware version 02_08_03
12/25/23 13:39:58z SPIFFS mounted.
12/25/23 08:39:58 Local time zone: -5:00, using DST/BST when in effect.
12/25/23 08:39:58 device name: IotaWatt
12/25/23 08:40:01 Connecting with WiFiManager.
12/25/23 08:40:06 HTTP server started
12/25/23 08:40:06 influxDB_v1: Starting, interval:5, url:http://192.168.1.240:8086
12/25/23 08:40:06 WiFi connected. SSID=ATT6AbiV3A, IP=192.168.1.233, channel=4, RSSI -57db
12/25/23 08:40:06 timeSync: service started.
12/25/23 08:40:06 statService: started.
12/25/23 08:40:06 Updater: service started. Auto-update class is MINOR
12/25/23 08:40:07 dataLog: service started.
12/25/23 08:40:08 dataLog: Last log entry 12/25/23 08:39:50
12/25/23 08:40:11 historyLog: service started.
12/25/23 08:40:11 historyLog: Last log entry 12/25/23 08:39:00
12/25/23 08:40:39 Updater: Auto-update is current for class MINOR.
12/25/23 08:41:46 influxDB_v1: Start posting at 12/25/23 08:39:45
1/05/24 14:40:05 influxDB_v1: stopped, Last post 01/05/24 14:39:40
1/05/24 16:19:00 influxDB_v1: Start posting at 12/31/23 19:00:05
1/06/24 13:31:35 influxDB_v1: stopped, Last post 01/06/24 13:31:25
1/06/24 13:33:40 influxDB_v1: Start posting at 12/31/23 19:00:05
1/06/24 13:50:27 Restart command received.

** Restart **

SD initialized.
1/06/24 18:50:30z Real Time Clock is running. Unix time 1704567030
1/06/24 18:50:30z Reset reason: Software/System restart
1/06/24 18:50:30z Trace: 1:3, 1:3, 1:3, 1:3, 1:3, 1:1[1], 1:2[2], 9:0[2], 9:0, 9:1, 8:4, 8:6, 8:8, 9:3, 9:5, 9:9, 1:3, 1:3, 1:1[2], 1:2[3], 9:0[3], 9:0, 9:1, 8:4, 8:6, 8:8, 9:3, 9:5, 9:9, 1:3, 10:2, 10:3
1/06/24 18:50:30z ESP8266 ID: 6195317, RTC PCF8523 (68)
1/06/24 18:50:30z IoTaWatt 5.0, Firmware version 02_08_03
1/06/24 18:50:30z SPIFFS mounted.
1/06/24 13:50:30 Local time zone: -5:00, using DST/BST when in effect.
1/06/24 13:50:30 device name: IotaWatt
1/06/24 13:50:30 HTTP server started
1/06/24 13:50:30 influxDB_v1: Starting, interval:5, url:http://192.168.1.240:8086
1/06/24 13:50:30 timeSync: service started.
1/06/24 13:50:30 statService: started.
1/06/24 13:50:30 dataLog: service started.
1/06/24 13:50:32 dataLog: Last log entry 01/06/24 13:50:25
1/06/24 13:50:35 historyLog: service started.
1/06/24 13:50:35 historyLog: Last log entry 01/06/24 13:50:00
1/06/24 13:50:35 WiFi connected. SSID=ATT6AbiV3A, IP=192.168.1.233, channel=3, RSSI -60db
1/06/24 13:50:35 Updater: service started. Auto-update class is MINOR
1/06/24 13:50:50 Updater: Auto-update is current for class MINOR.

** Restart **

SD initialized.
1/06/24 18:50:59z Real Time Clock is running. Unix time 1704567059
1/06/24 18:50:59z Reset reason: Exception
1/06/24 18:50:59z Trace: 32:30, 32:35, 32:35, 32:35, 32:35, 32:37, 31:1, 1:6[6], 1:3, 1:3, 1:1[5], 1:2[6], 9:0[6], 9:0, 9:1, 8:4, 8:6, 8:8, 9:3, 9:5, 9:9, 1:3, 1:3, 1:6[1], 1:6[3], 1:5[31], 1:6[4], 31:0, 31:1, 31:2[1], 32:20, 32:20
1/06/24 18:50:59z ESP8266 ID: 6195317, RTC PCF8523 (68)
1/06/24 18:50:59z IoTaWatt 5.0, Firmware version 02_08_03
1/06/24 18:50:59z SPIFFS mounted.
1/06/24 13:50:59 Local time zone: -5:00, using DST/BST when in effect.
1/06/24 13:50:59 device name: IotaWatt
1/06/24 13:50:59 HTTP server started
1/06/24 13:50:59 influxDB_v1: Starting, interval:5, url:http://192.168.1.240:8086
1/06/24 13:50:59 timeSync: service started.
1/06/24 13:50:59 statService: started.
1/06/24 13:50:59 dataLog: service started.
1/06/24 13:51:01 dataLog: Last log entry 01/06/24 13:50:55
1/06/24 13:51:04 historyLog: service started.
1/06/24 13:51:04 historyLog: Last log entry 01/06/24 13:50:00
1/06/24 13:51:04 WiFi connected. SSID=ATT6AbiV3A, IP=192.168.1.233, channel=3, RSSI -60db
1/06/24 13:51:04 Updater: service started. Auto-update class is MINOR
1/06/24 13:51:12 influxDB_v1: stopped, Last post 02/06/06 01:28:16
1/06/24 13:51:14 Updater: Auto-update is current for class MINOR.
1/06/24 13:52:26 influxDB_v1: Start posting at 12/31/23 19:00:05
1/06/24 13:53:27 influxDB_v1: stopped, Last post 12/31/23 19:01:00
1/06/24 13:55:37 influxDB_v1: Start posting at 12/31/23 19:02:05

Looks fine. Is the Last Update time advancing through the backlog period?

If you still have a problem, please post your influx uploader setup and description of what you believe is missing.

The Last Update is advancing through the backlog period. It is now showing the current date and time as the data is being uploaded. Not sure how to tell you any better what I feel is missing. If you look at the above InfluxDB panel there is something screwy going on with the data between 2-6 Jan. The graph+ panel definitely seems to show there is some data during that period in the IotaWatt database. I’ve attached 2 more screen shots where I’ve zoomed in on the data for 2-6 Jan. The InfluxDB panel says there is no data to show while the Iotawatt panel shows data for exactly the same period. I’ve also attached the uploader setup screen which I had not changed for some time except for the Upload History From date.


Not saying it is or isn’t uploading, but Grafana is not influx. If you have current data, then its probably not uploading that gap period.

In the last restart above theree is a message:

That appears to have uploaded 2 minutes worth of data (24 frames) in about a minute. Subsequently, it should have taken many hours to upload the rest of the 7 or so days. During that time, you would see the Last Update Time advancing slowly. If that is happening, data should be uploaded.

How long did it take?

What is the output Total_Power?

What does influx show for the series that you are querying with Grafana?

I’ve attached a query of the InfluxDB. You can see around line 20 it skips from 1 Jan to 6 Jan so it appears there was no data uploaded for that period. I’ll delete the 2024 data from the InfluxDB and reupload it tomorrow. I’ll keep an eye on what happens after that date/time and let you know.

Its possible that you have a damaged datalog. Can you plot Total_Power Watts using Graph+ for a period of an hour or less (5 second intervals) covering 1/1/2024 19:45:20?

I just stopped the uploader, cleared the database and restarted the uploader (did it twice just to make sure I saw was was happening). I’ve attached a screen shot of the uploader screen showing the last update of the afternoon of 1 Jan. It sat there like that for a few minutes, with no errors, but no progression either. Then all of the sudden, it jumped to 8 Jan. I stopped the uploader and have included the last portion of the log showing the jump. I’m working on the graph+ plot you requested.

** Restart **

SD initialized.
1/06/24 18:50:59z Real Time Clock is running. Unix time 1704567059
1/06/24 18:50:59z Reset reason: Exception
1/06/24 18:50:59z Trace: 32:30, 32:35, 32:35, 32:35, 32:35, 32:37, 31:1, 1:6[6], 1:3, 1:3, 1:1[5], 1:2[6], 9:0[6], 9:0, 9:1, 8:4, 8:6, 8:8, 9:3, 9:5, 9:9, 1:3, 1:3, 1:6[1], 1:6[3], 1:5[31], 1:6[4], 31:0, 31:1, 31:2[1], 32:20, 32:20
1/06/24 18:50:59z ESP8266 ID: 6195317, RTC PCF8523 (68)
1/06/24 18:50:59z IoTaWatt 5.0, Firmware version 02_08_03
1/06/24 18:50:59z SPIFFS mounted.
1/06/24 13:50:59 Local time zone: -5:00, using DST/BST when in effect.
1/06/24 13:50:59 device name: IotaWatt
1/06/24 13:50:59 HTTP server started
1/06/24 13:50:59 influxDB_v1: Starting, interval:5, url:http://192.168.1.240:8086
1/06/24 13:50:59 timeSync: service started.
1/06/24 13:50:59 statService: started.
1/06/24 13:50:59 dataLog: service started.
1/06/24 13:51:01 dataLog: Last log entry 01/06/24 13:50:55
1/06/24 13:51:04 historyLog: service started.
1/06/24 13:51:04 historyLog: Last log entry 01/06/24 13:50:00
1/06/24 13:51:04 WiFi connected. SSID=ATT6AbiV3A, IP=192.168.1.233, channel=3, RSSI -60db
1/06/24 13:51:04 Updater: service started. Auto-update class is MINOR
1/06/24 13:51:12 influxDB_v1: stopped, Last post 02/06/06 01:28:16
1/06/24 13:51:14 Updater: Auto-update is current for class MINOR.
1/06/24 13:52:26 influxDB_v1: Start posting at 12/31/23 19:00:05
1/06/24 13:53:27 influxDB_v1: stopped, Last post 12/31/23 19:01:00
1/06/24 13:55:37 influxDB_v1: Start posting at 12/31/23 19:02:05
1/08/24 14:46:22 influxDB_v1: stopped, Last post 01/08/24 14:46:05
1/08/24 14:51:14 influxDB_v1: Start posting at 01/01/24 14:45:25
1/08/24 14:55:44 influxDB_v1: stopped, Last post 01/08/24 14:55:10
1/08/24 14:58:33 influxDB_v1: Start posting at 01/01/24 14:45:25
1/08/24 15:00:59 influxDB_v1: stopped, Last post 01/08/24 14:56:25

Just noticed the time I gave you was ZULU, please focus on 1/1/2024 14:45pm (UTC-5 aka EST).

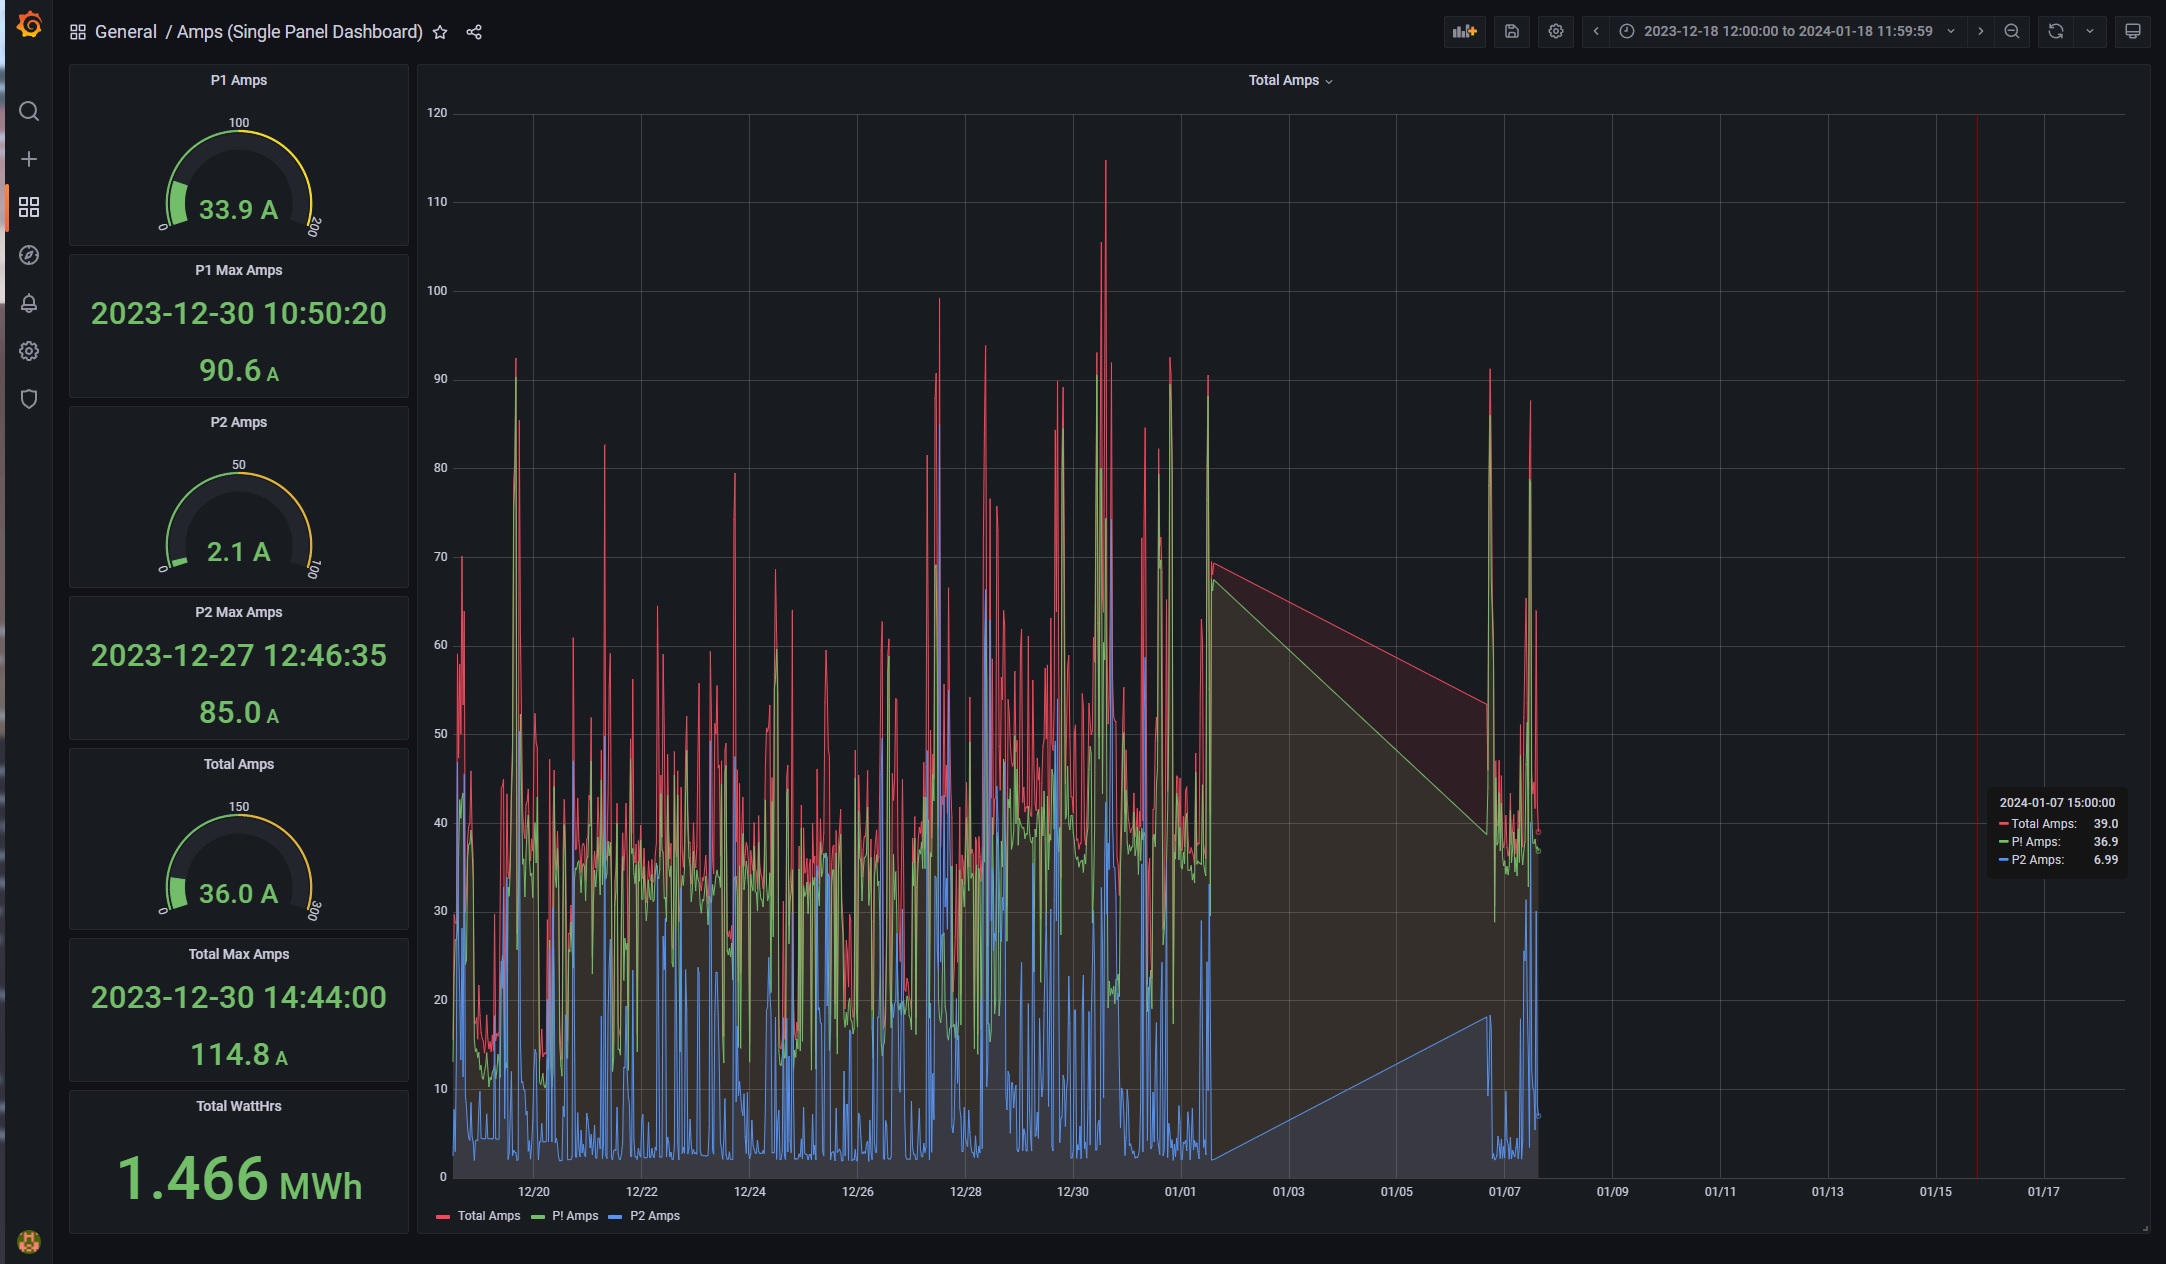
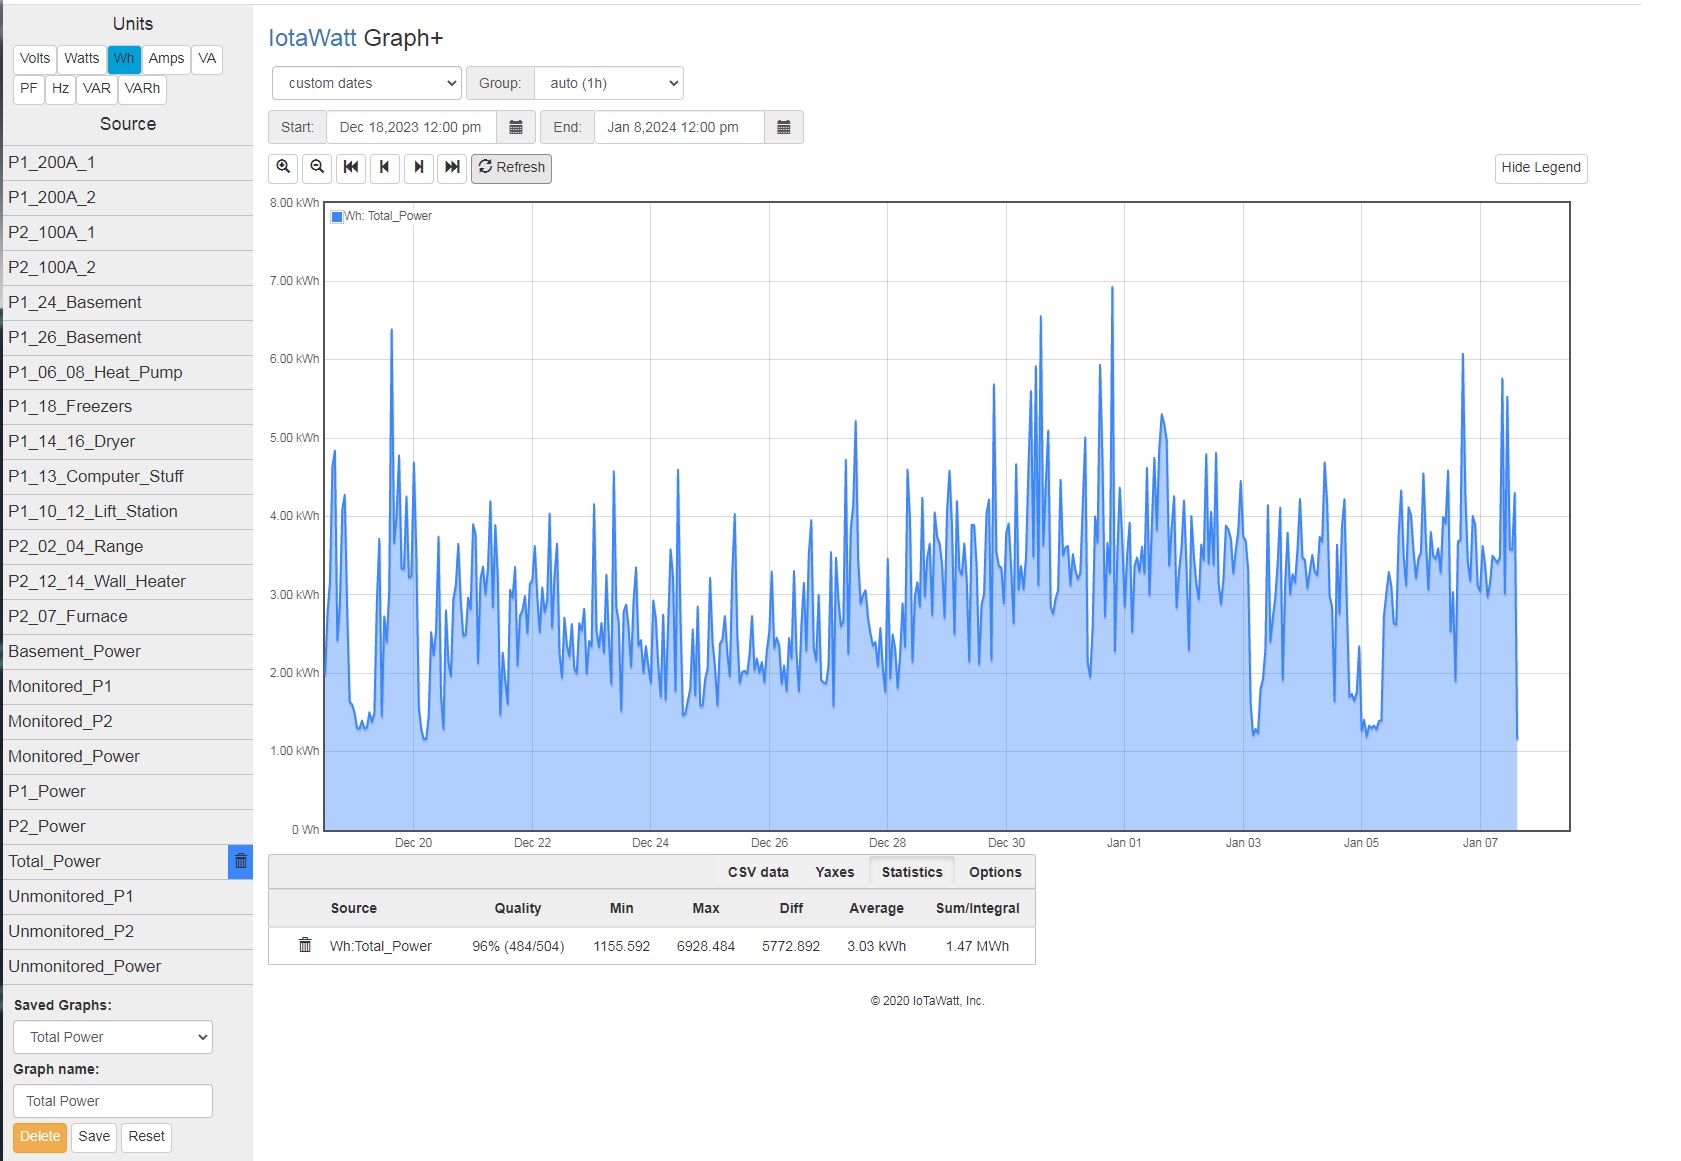
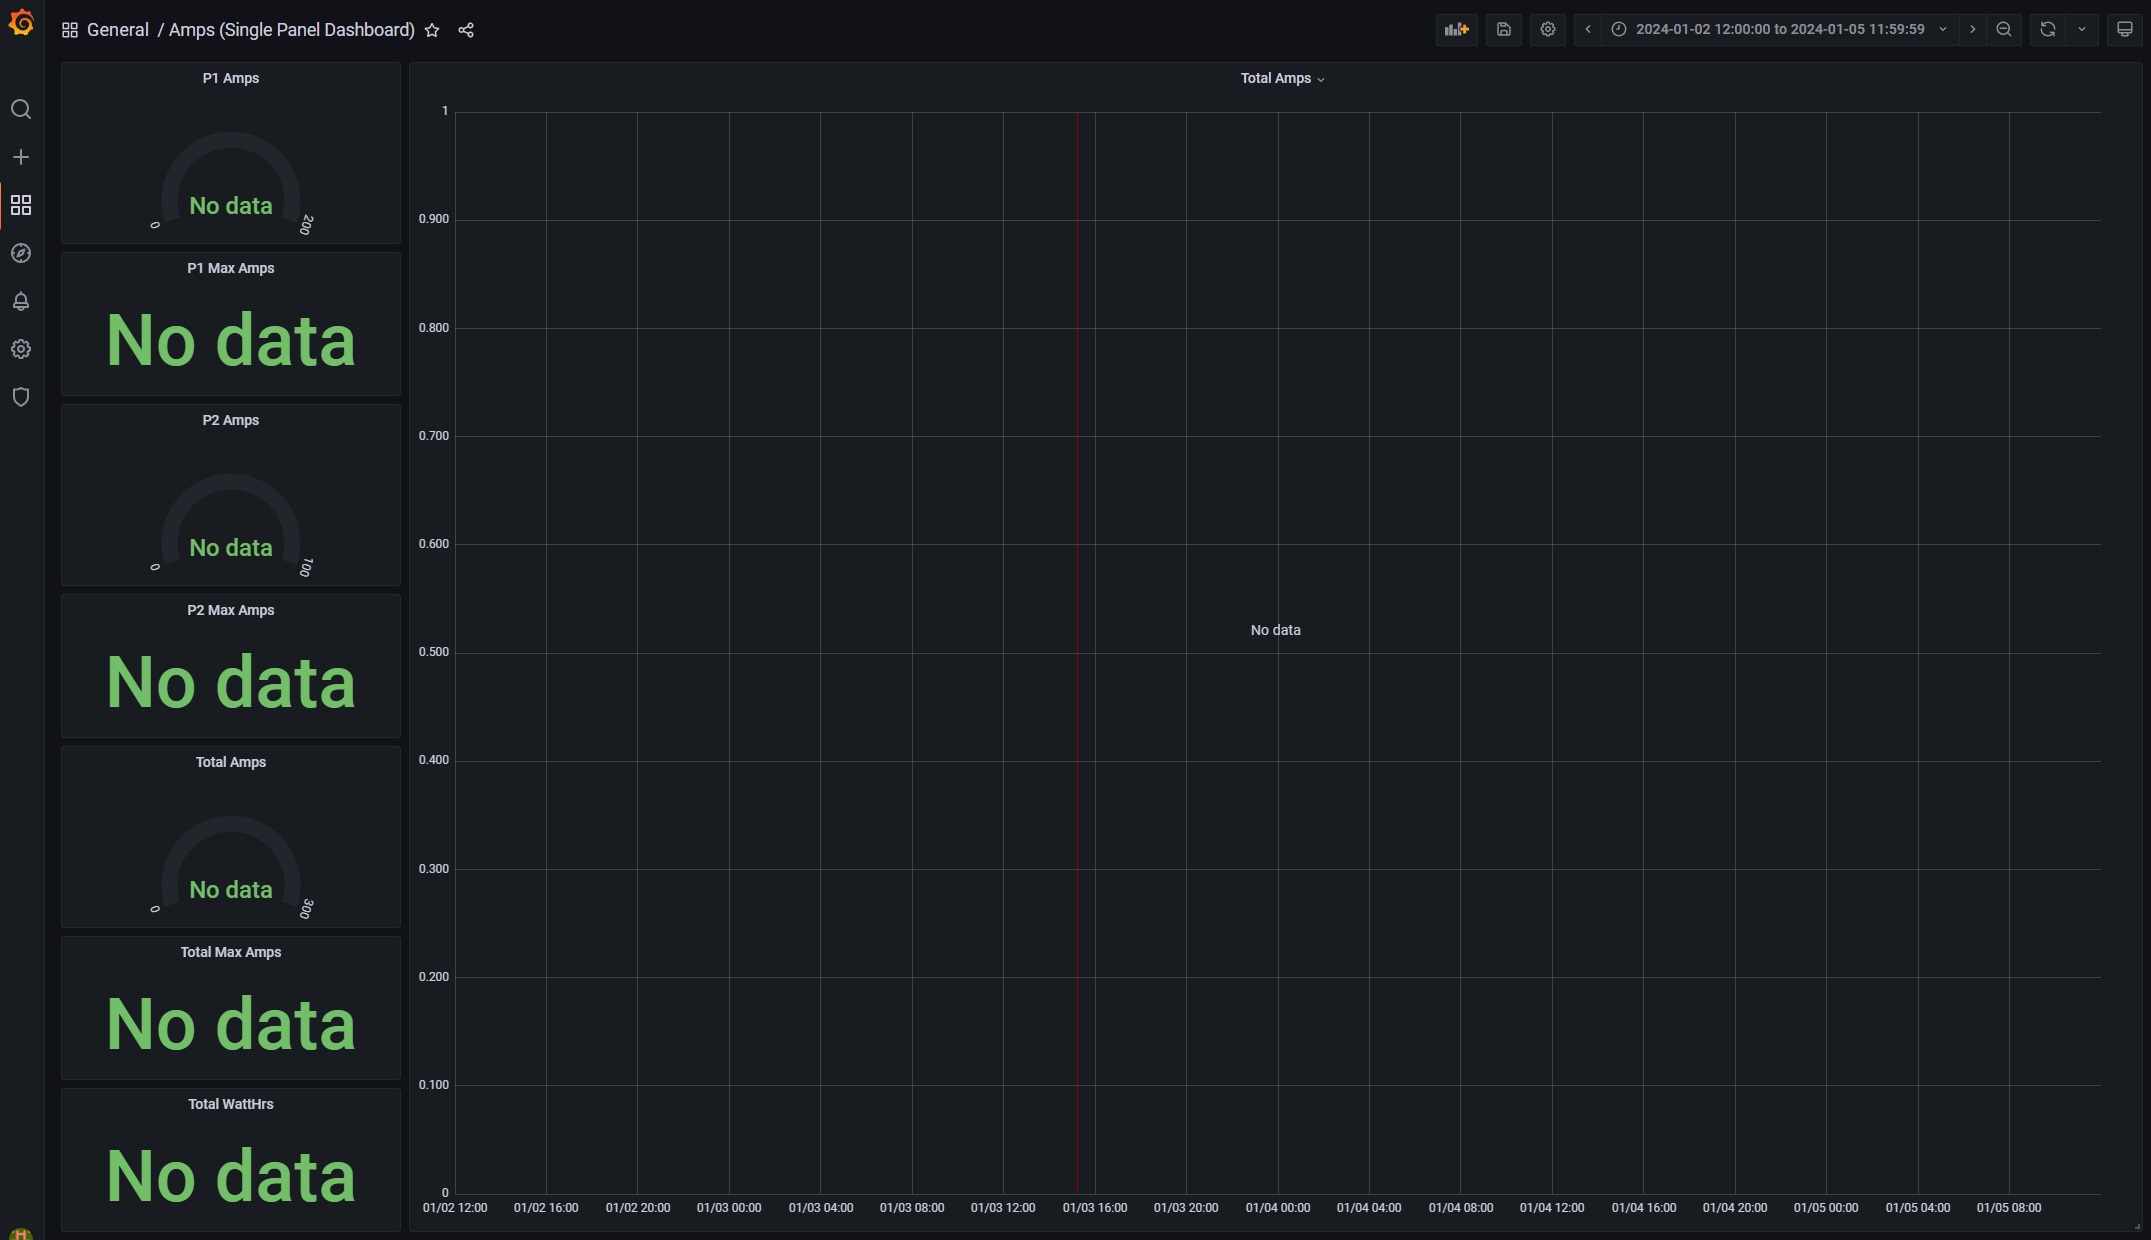
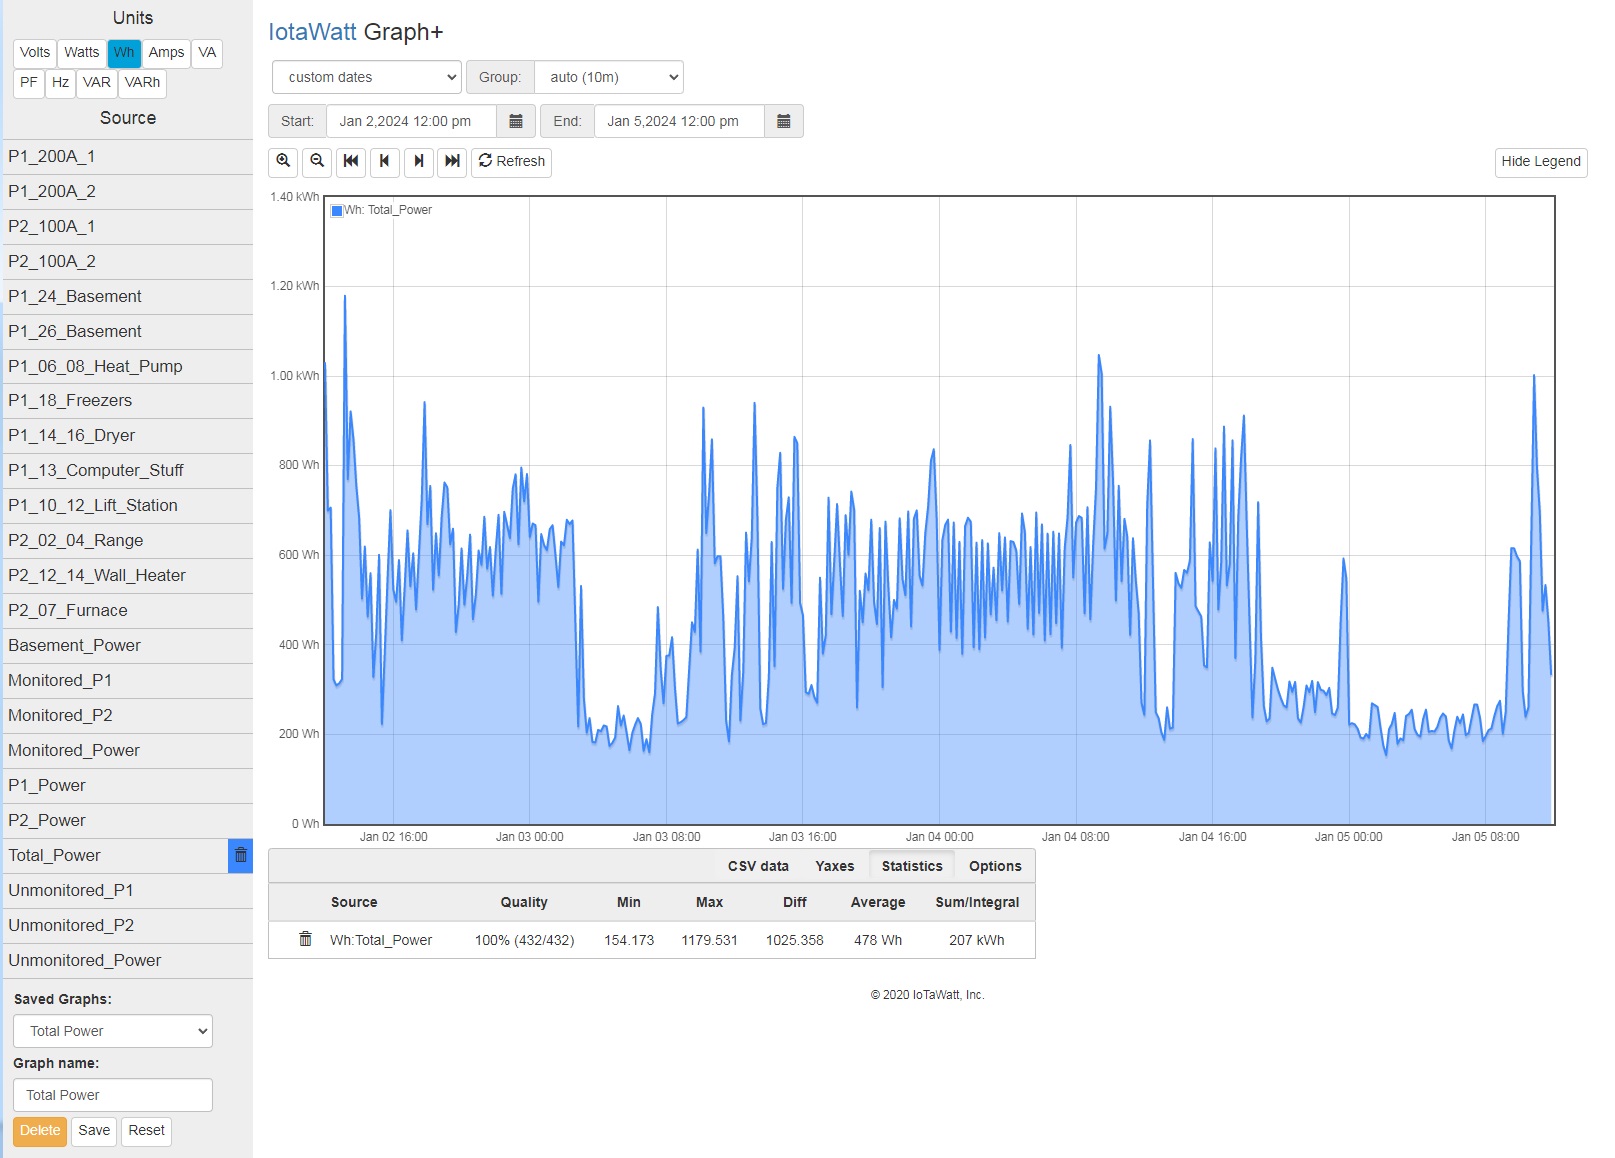
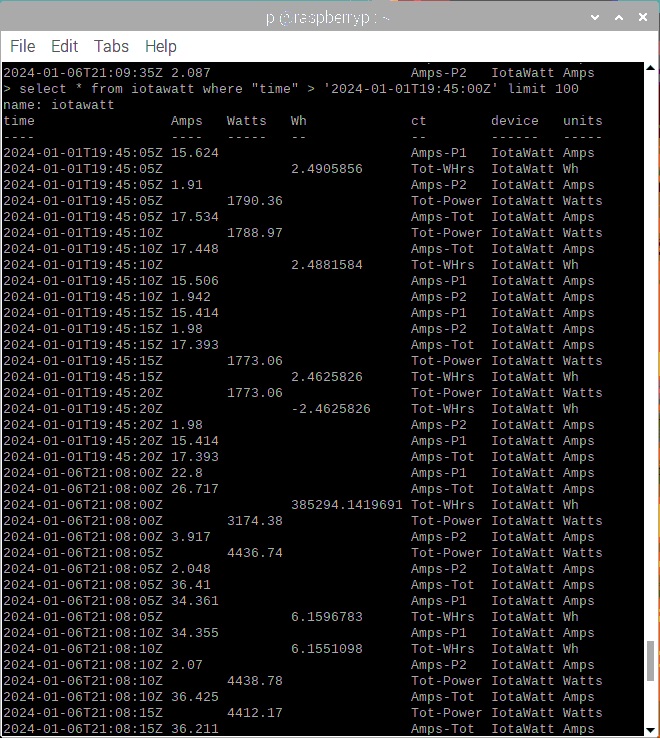
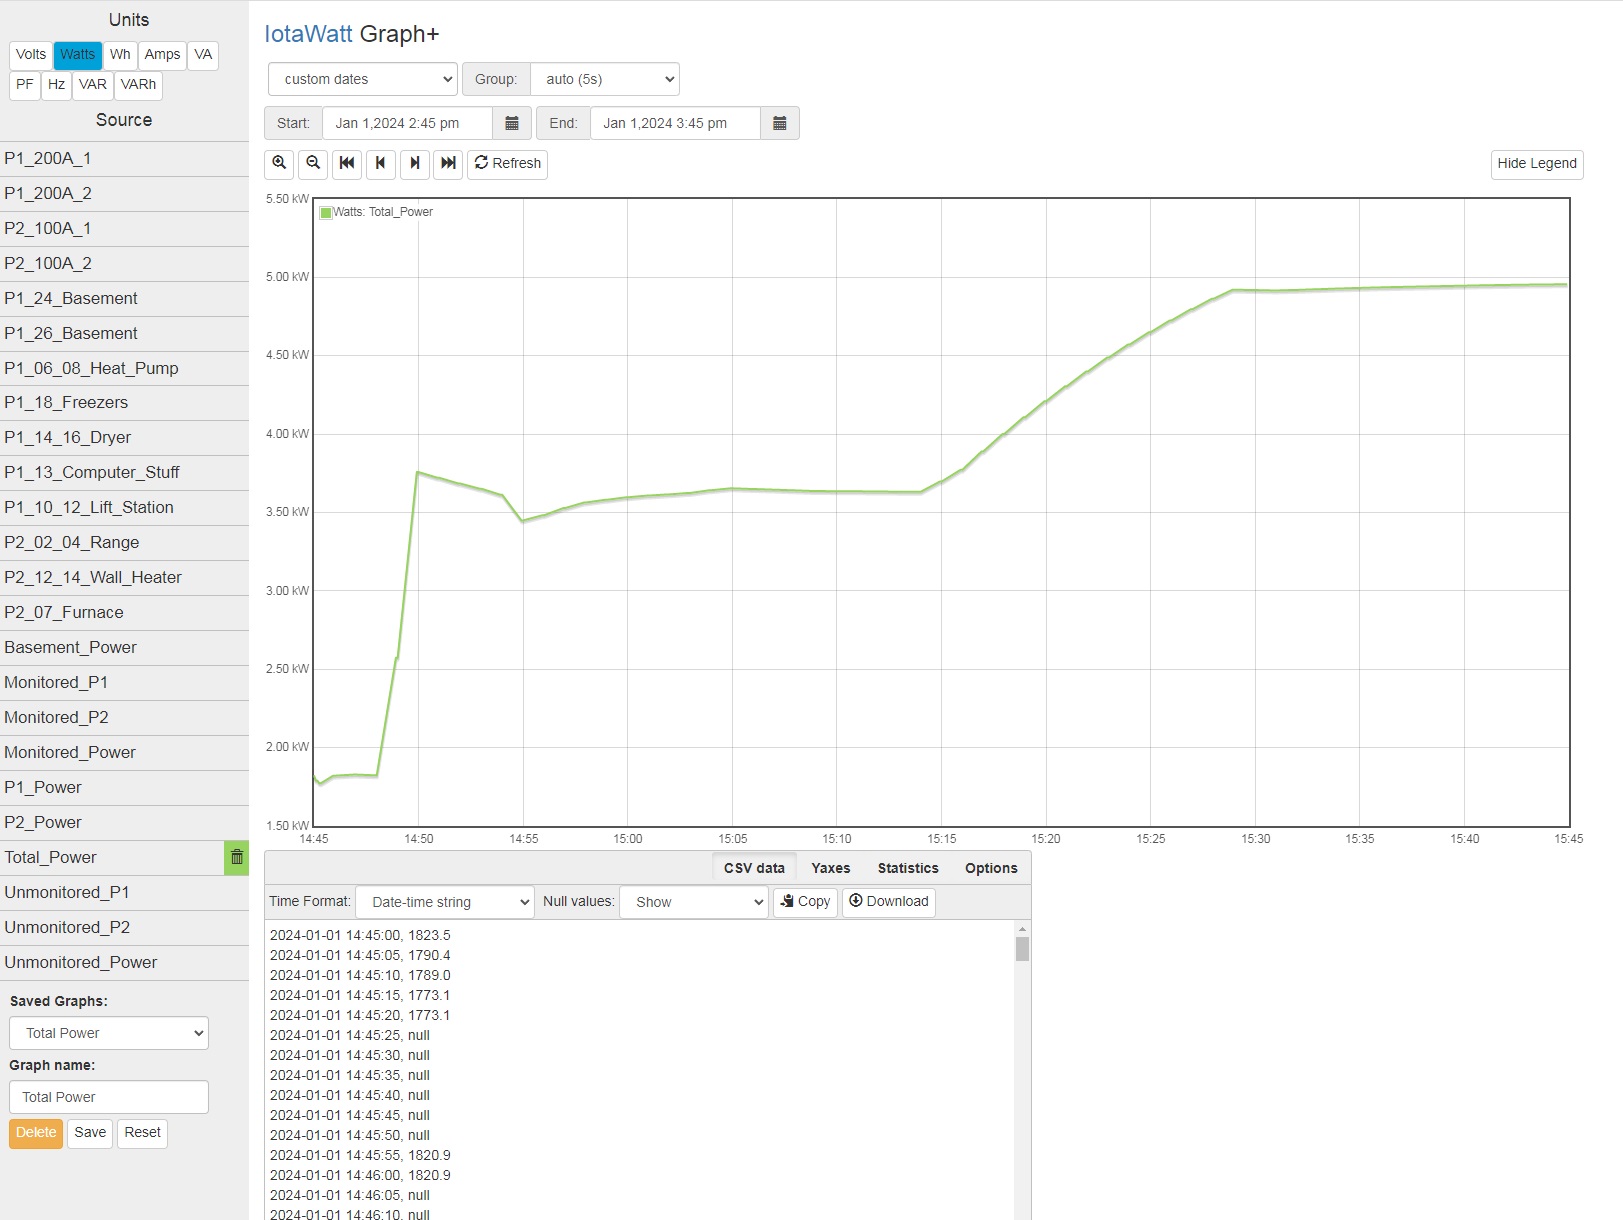
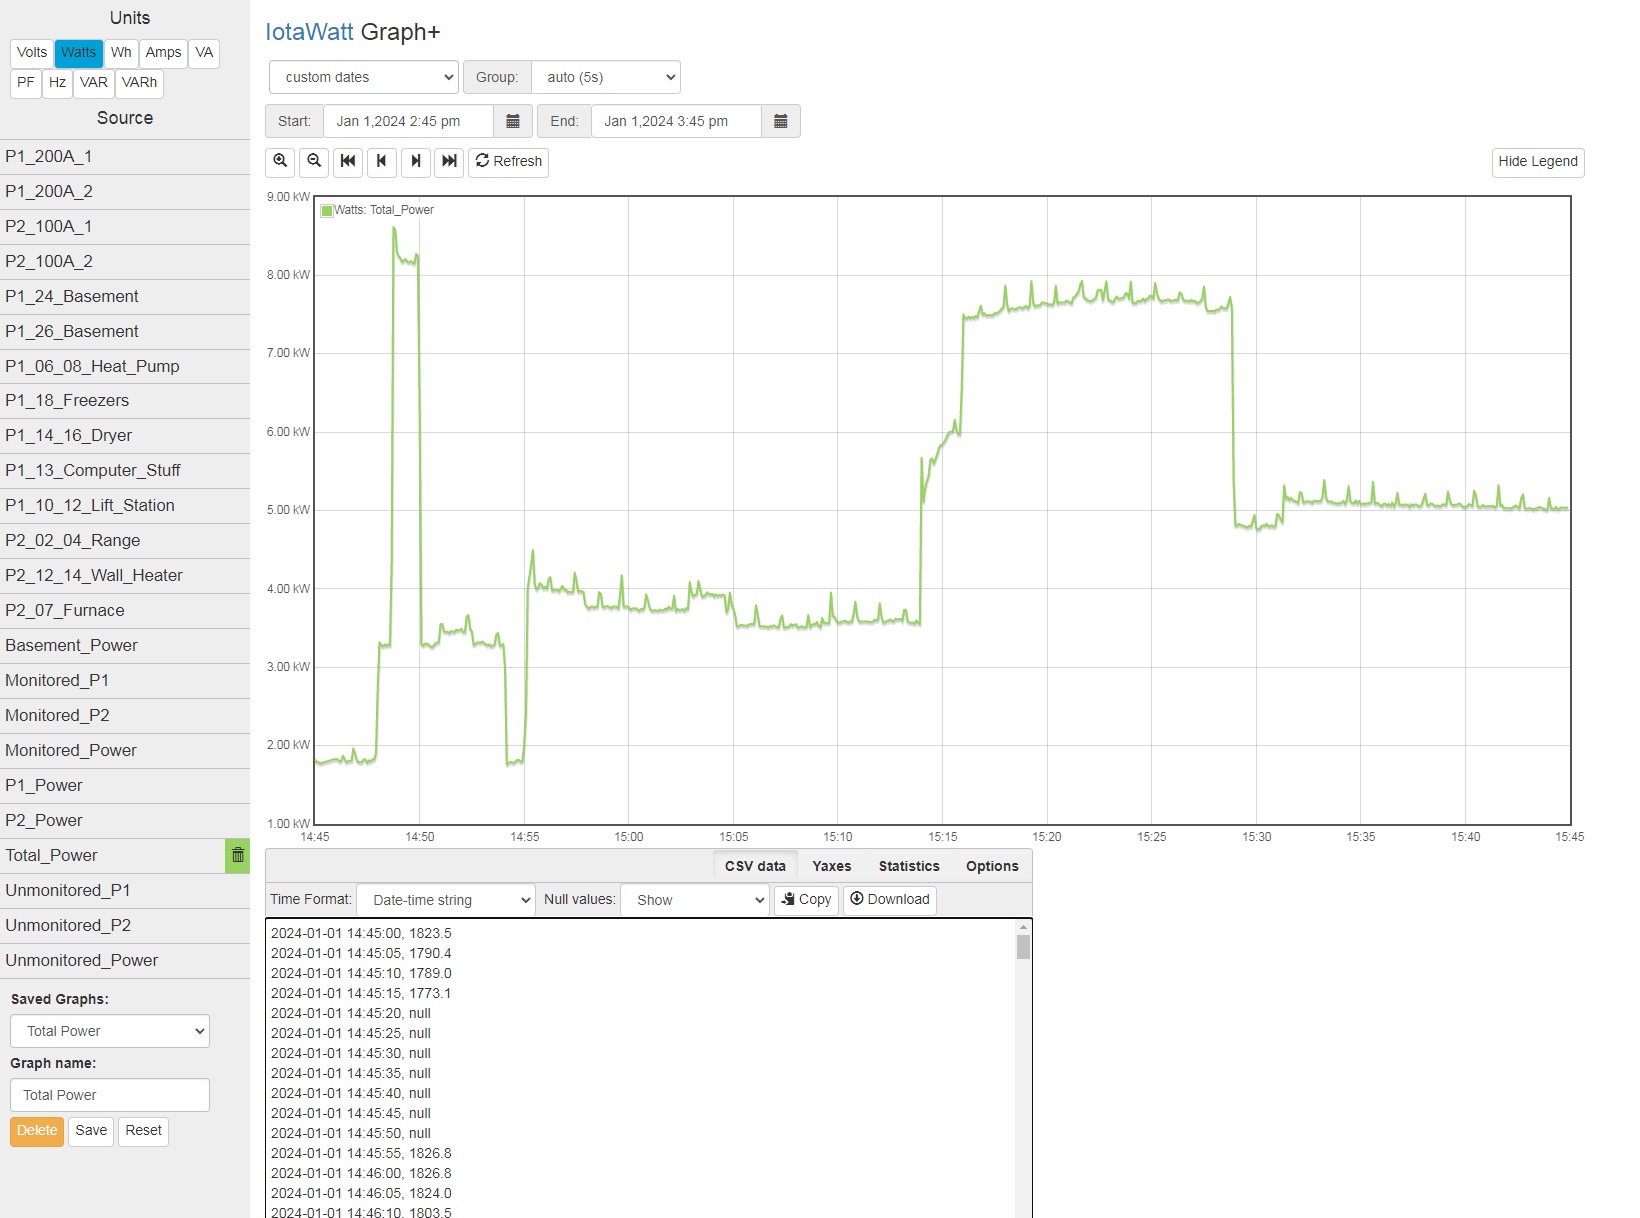
Hopefully this is what you’re looking for. Interesting that looking at the CSV display there are a lot of null values.

2024-01-01 14:45:00, 1823.5
2024-01-01 14:45:05, 1790.4
2024-01-01 14:45:10, 1789.0
2024-01-01 14:45:15, 1773.1
2024-01-01 14:45:20, 1773.1
2024-01-01 14:45:25, null
2024-01-01 14:45:30, null
2024-01-01 14:45:35, null
2024-01-01 14:45:40, null
2024-01-01 14:45:45, null
2024-01-01 14:45:50, null
2024-01-01 14:45:55, 1820.9
2024-01-01 14:46:00, 1820.9
2024-01-01 14:46:05, null
2024-01-01 14:46:10, null
2024-01-01 14:46:15, null
2024-01-01 14:46:20, null
2024-01-01 14:46:25, null
2024-01-01 14:46:30, null
2024-01-01 14:46:35, null
2024-01-01 14:46:40, null
2024-01-01 14:46:45, null
2024-01-01 14:46:50, null
2024-01-01 14:46:55, 1828.1
2024-01-01 14:47:00, 1828.1
2024-01-01 14:47:05, null
2024-01-01 14:47:10, null
2024-01-01 14:47:15, null
2024-01-01 14:47:20, null
2024-01-01 14:47:25, null
2024-01-01 14:47:30, null
2024-01-01 14:47:35, null
2024-01-01 14:47:40, null
2024-01-01 14:47:45, null
2024-01-01 14:47:50, null
2024-01-01 14:47:55, 1823.4
2024-01-01 14:48:00, 1823.4
2024-01-01 14:48:05, null
2024-01-01 14:48:10, null
2024-01-01 14:48:15, null
2024-01-01 14:48:20, null
2024-01-01 14:48:25, null
2024-01-01 14:48:30, null
2024-01-01 14:48:35, null
2024-01-01 14:48:40, null
2024-01-01 14:48:45, null
2024-01-01 14:48:50, null
2024-01-01 14:48:55, 2573.4
2024-01-01 14:49:00, 2573.4
2024-01-01 14:49:05, null
2024-01-01 14:49:10, null
2024-01-01 14:49:15, null
2024-01-01 14:49:20, null
2024-01-01 14:49:25, null
2024-01-01 14:49:30, null
2024-01-01 14:49:35, null
2024-01-01 14:49:40, null
2024-01-01 14:49:45, null
2024-01-01 14:49:50, null
2024-01-01 14:49:55, 3758.0
2024-01-01 14:50:00, 3758.0
2024-01-01 14:50:05, null
2024-01-01 14:50:10, null
2024-01-01 14:50:15, null
2024-01-01 14:50:20, null
2024-01-01 14:50:25, null
2024-01-01 14:50:30, null
2024-01-01 14:50:35, null
2024-01-01 14:50:40, null
2024-01-01 14:50:45, null
2024-01-01 14:50:50, null
2024-01-01 14:50:55, 3721.1
2024-01-01 14:51:00, 3721.1
2024-01-01 14:51:05, null
2024-01-01 14:51:10, null
2024-01-01 14:51:15, null
2024-01-01 14:51:20, null
2024-01-01 14:51:25, null
2024-01-01 14:51:30, null
2024-01-01 14:51:35, null
2024-01-01 14:51:40, null
2024-01-01 14:51:45, null
2024-01-01 14:51:50, null
2024-01-01 14:51:55, 3684.5
2024-01-01 14:52:00, 3684.5
2024-01-01 14:52:05, null
2024-01-01 14:52:10, null
2024-01-01 14:52:15, null
2024-01-01 14:52:20, null
2024-01-01 14:52:25, null
2024-01-01 14:52:30, null
2024-01-01 14:52:35, null
2024-01-01 14:52:40, null
2024-01-01 14:52:45, null
2024-01-01 14:52:50, null
2024-01-01 14:52:55, 3651.9
2024-01-01 14:53:00, 3651.9
2024-01-01 14:53:05, null
2024-01-01 14:53:10, null
2024-01-01 14:53:15, null
2024-01-01 14:53:20, null
2024-01-01 14:53:25, null
2024-01-01 14:53:30, null
2024-01-01 14:53:35, null
2024-01-01 14:53:40, null
2024-01-01 14:53:45, null
2024-01-01 14:53:50, null
2024-01-01 14:53:55, 3613.1
2024-01-01 14:54:00, 3613.1
2024-01-01 14:54:05, null
2024-01-01 14:54:10, null
2024-01-01 14:54:15, null
2024-01-01 14:54:20, null
2024-01-01 14:54:25, null
2024-01-01 14:54:30, null
2024-01-01 14:54:35, null
2024-01-01 14:54:40, null
2024-01-01 14:54:45, null
2024-01-01 14:54:50, null
2024-01-01 14:54:55, 3449.5
2024-01-01 14:55:00, 3449.5
2024-01-01 14:55:05, null
2024-01-01 14:55:10, null
2024-01-01 14:55:15, null
2024-01-01 14:55:20, null
2024-01-01 14:55:25, null
2024-01-01 14:55:30, null
2024-01-01 14:55:35, null
2024-01-01 14:55:40, null
2024-01-01 14:55:45, null
2024-01-01 14:55:50, null
2024-01-01 14:55:55, 3482.1
2024-01-01 14:56:00, 3482.1
2024-01-01 14:56:05, null
2024-01-01 14:56:10, null
2024-01-01 14:56:15, null
2024-01-01 14:56:20, null
2024-01-01 14:56:25, null
2024-01-01 14:56:30, null
2024-01-01 14:56:35, null
2024-01-01 14:56:40, null
2024-01-01 14:56:45, null
2024-01-01 14:56:50, null
2024-01-01 14:56:55, 3528.0
2024-01-01 14:57:00, 3528.0
2024-01-01 14:57:05, null
2024-01-01 14:57:10, null
2024-01-01 14:57:15, null
2024-01-01 14:57:20, null
2024-01-01 14:57:25, null
2024-01-01 14:57:30, null
2024-01-01 14:57:35, null
2024-01-01 14:57:40, null
2024-01-01 14:57:45, null
2024-01-01 14:57:50, null
2024-01-01 14:57:55, 3563.8
2024-01-01 14:58:00, 3563.8
2024-01-01 14:58:05, null
2024-01-01 14:58:10, null
2024-01-01 14:58:15, null
2024-01-01 14:58:20, null
2024-01-01 14:58:25, null
2024-01-01 14:58:30, null
2024-01-01 14:58:35, null
2024-01-01 14:58:40, null
2024-01-01 14:58:45, null
2024-01-01 14:58:50, null
2024-01-01 14:58:55, 3580.9
2024-01-01 14:59:00, 3580.9
2024-01-01 14:59:05, null
2024-01-01 14:59:10, null
2024-01-01 14:59:15, null
2024-01-01 14:59:20, null
2024-01-01 14:59:25, null
2024-01-01 14:59:30, null
2024-01-01 14:59:35, null
2024-01-01 14:59:40, null
2024-01-01 14:59:45, null
2024-01-01 14:59:50, null
2024-01-01 14:59:55, 3596.9
2024-01-01 15:00:00, 3596.9
2024-01-01 15:00:05, null
2024-01-01 15:00:10, null
2024-01-01 15:00:15, null
2024-01-01 15:00:20, null
2024-01-01 15:00:25, null
2024-01-01 15:00:30, null
2024-01-01 15:00:35, null
2024-01-01 15:00:40, null
2024-01-01 15:00:45, null
2024-01-01 15:00:50, null
2024-01-01 15:00:55, 3607.9
2024-01-01 15:01:00, 3607.9
2024-01-01 15:01:05, null
2024-01-01 15:01:10, null
2024-01-01 15:01:15, null
2024-01-01 15:01:20, null
2024-01-01 15:01:25, null
2024-01-01 15:01:30, null
2024-01-01 15:01:35, null
2024-01-01 15:01:40, null
2024-01-01 15:01:45, null
2024-01-01 15:01:50, null
2024-01-01 15:01:55, 3615.5
2024-01-01 15:02:00, 3615.5
2024-01-01 15:02:05, null
2024-01-01 15:02:10, null
2024-01-01 15:02:15, null
2024-01-01 15:02:20, null
2024-01-01 15:02:25, null
2024-01-01 15:02:30, null
2024-01-01 15:02:35, null
2024-01-01 15:02:40, null
2024-01-01 15:02:45, null
2024-01-01 15:02:50, null
2024-01-01 15:02:55, 3624.9
2024-01-01 15:03:00, 3624.9
2024-01-01 15:03:05, null
2024-01-01 15:03:10, null
2024-01-01 15:03:15, null
2024-01-01 15:03:20, null
2024-01-01 15:03:25, null
2024-01-01 15:03:30, null
2024-01-01 15:03:35, null
2024-01-01 15:03:40, null
2024-01-01 15:03:45, null
2024-01-01 15:03:50, null
2024-01-01 15:03:55, 3642.1
2024-01-01 15:04:00, 3642.1
2024-01-01 15:04:05, null
2024-01-01 15:04:10, null
2024-01-01 15:04:15, null
2024-01-01 15:04:20, null
2024-01-01 15:04:25, null
2024-01-01 15:04:30, null
2024-01-01 15:04:35, null
2024-01-01 15:04:40, null
2024-01-01 15:04:45, null
2024-01-01 15:04:50, null
2024-01-01 15:04:55, 3654.2
2024-01-01 15:05:00, 3654.2

Even more interesting, when I redid the graph I got different results (also note most of the null values are gone):

2024-01-01 14:45:00, 1823.5
2024-01-01 14:45:05, 1790.4
2024-01-01 14:45:10, 1789.0
2024-01-01 14:45:15, 1773.1
2024-01-01 14:45:20, null
2024-01-01 14:45:25, null
2024-01-01 14:45:30, null
2024-01-01 14:45:35, null
2024-01-01 14:45:40, null
2024-01-01 14:45:45, null
2024-01-01 14:45:50, null
2024-01-01 14:45:55, 1826.8
2024-01-01 14:46:00, 1826.8
2024-01-01 14:46:05, 1824.0
2024-01-01 14:46:10, 1803.5
2024-01-01 14:46:15, 1802.7
2024-01-01 14:46:20, 1871.2
2024-01-01 14:46:25, 1829.3
2024-01-01 14:46:30, 1787.6
2024-01-01 14:46:35, 1802.2
2024-01-01 14:46:40, 1806.6
2024-01-01 14:46:45, 1807.3
2024-01-01 14:46:50, 1965.7
2024-01-01 14:46:55, 1899.6
2024-01-01 14:47:00, 1813.6
2024-01-01 14:47:05, 1792.0
2024-01-01 14:47:10, 1787.4
2024-01-01 14:47:15, 1794.5
2024-01-01 14:47:20, 1825.3
2024-01-01 14:47:25, 1822.0
2024-01-01 14:47:30, 1780.8
2024-01-01 14:47:35, 1812.1
2024-01-01 14:47:40, 1799.0
2024-01-01 14:47:45, 1825.5
2024-01-01 14:47:50, 1824.5
2024-01-01 14:47:55, 1907.0
2024-01-01 14:48:00, 2752.0
2024-01-01 14:48:05, 3319.1
2024-01-01 14:48:10, 3284.9
2024-01-01 14:48:15, 3266.8
2024-01-01 14:48:20, 3291.6
2024-01-01 14:48:25, 3274.1
2024-01-01 14:48:30, 3294.0
2024-01-01 14:48:35, 3279.5
2024-01-01 14:48:40, 4354.9
2024-01-01 14:48:45, 8615.0
2024-01-01 14:48:50, 8586.2
2024-01-01 14:48:55, 8296.8
2024-01-01 14:49:00, 8248.7
2024-01-01 14:49:05, 8219.4
2024-01-01 14:49:10, 8170.5
2024-01-01 14:49:15, 8196.0
2024-01-01 14:49:20, 8208.6
2024-01-01 14:49:25, 8173.7
2024-01-01 14:49:30, 8166.0
2024-01-01 14:49:35, 8180.8
2024-01-01 14:49:40, 8163.8
2024-01-01 14:49:45, 8151.1
2024-01-01 14:49:50, 8272.1
2024-01-01 14:49:55, 8253.4
2024-01-01 14:50:00, 6338.7
2024-01-01 14:50:05, 3298.3
2024-01-01 14:50:10, 3277.0
2024-01-01 14:50:15, 3298.8
2024-01-01 14:50:20, 3299.8
2024-01-01 14:50:25, 3294.1
2024-01-01 14:50:30, 3271.3
2024-01-01 14:50:35, 3258.6

I’ve also seen this error screen a few times now. I get it when I hit the restart button. I just acknowledge the screen and restart the database and it seems to take off.

That usually happens if you have more than one instance of the config app open. You update with one and subsequently update with the other. IoTaWatt recognizes that the update is to a stale config and rejects it.

Regarding the query of Jan 1 ~14:45, it appears there is no data available in the current log. What you are seeing is data from the history log only which is one minute data. The influx uploader only uses the current log, so it sees no data for that period. Query will use either, and so that’s why you see the data in Graph+ which uses query.

Your message log does not show any problems during the outage period, and it appears that it resumes more or less spontaneously on Jan 6. That leads me to believe this has something to do with the SDcard. Your current log is wrapped, which means it doesn’t grow or shrink anymore, you should see the start time advance as new entries are added.

Your history log has 3 1/2 years of data, so I would recommend replacing the card. You can try just copying the old card to a new card and see how it works. You may encounter an error copying /iotawatt/iotalog.log (the current log). If so, delete it from the new card. IoTaWatt will create a new one starting from now.

You may get lucky and whatever you use to copy the card contents is able to read the bad sectors. Any evidence of problems and you should discard the current log.

It looks like I can get a 32GB level 10 microSD card from Best Buy for about $10. Would it use the entire 32GB of space or would that be a waste above 8GB? I’ll try copying the card first before starting from scratch.

The IoTaWatt only uses about 4GB. If there is any advantage in additional capacity, I think it might be in the availability of additional sectors to do wear leveling. Unfortunately, I’m not aware of any public information about how each vendor’s wear leveling works as it seems to be proprietary and the stuff of marketing claims.

Over the life of your unit, the IoTaWatt datalog code has been improved to very significantly reduce writes. The spate of SDcard failures evident in the forum is largely the result of a batch of defective cards that made their way into about 400 units that were shipped all over the world.

I did replace my home unit’s card a few years back out of an abundance of caution, but I have 7 years of history:

image

So when I pulled the memory card out, it was not readable by any of my computers, so I ended up rebuilding everything. I think I got it done with all of the screen shots I’ve taken. The only question I have left (right now anyway) has to do with the config file. In the config.txt file I downloaded to rebuild the card, the input section starts out:

},
"inputs": [
	{
		"channel": 0,
		"name": "Input_0",
		"type": "VT",
		"model": "Jameco/112336",
		"cal": 11.43,
		"phase": 0.6
	},

There was another post a while back where the same portion of the config.txt file read:

},
"inputs": [
	{
		"channel": 0,
		"name": "Input_0",
		"type": "VT",
		"model": "TDC DA-10-09-E6",
		"phase": 1.49,
		"cal": 10.79
	},

Is there a real difference between these 2 entries? Does it make a difference as to which one I use?

I did think of another question as well. What’s the difference between types VT and VC? The default was VC and that’s what I used when rebuilding the inputs, but I noticed the type on both of those entries above is VT.

Dave

I think I figured it out. I had to review the setup instructions but it appears I have a TDC DA-10-09 model VT, and all of the other inputs should be VC. Been a while since I’ve used those instructions.

Dave

Errr… CT?

You might look for the saved copy of your old config as described in this post:

Well, I’m kind of at a loss again. Here’s a screen shot of the status screen. I’ve got a 100A and a 200A panel that I’m monitoring. I rebuilt the IotaWatt config from all of the screen shots in my posts and am pretty sure it’s all set up like it was. I have all of the cables labeled for inputs 1-14 so I’m sure they’re the same as they were before my memory card went bad. Since I’ve only got 14 inputs it’s impossible to monitor all of the circuits in both panels so I decided to try and track the unmonitored circuits with the outputs I created. My question is, as shown in the status screen, how can I get negative unmonitored power? The total power should always be greater the the monitored power which should result in a positive unmonitored power. I’m at a complete loss here. I’ve also attached a spreadsheet I did to confirm the input and output numbers shown in the screen shot and a screen shot of the outputs I created. Finally, I should mention that those unmonitored numbers go positive and negative as the inputs change.