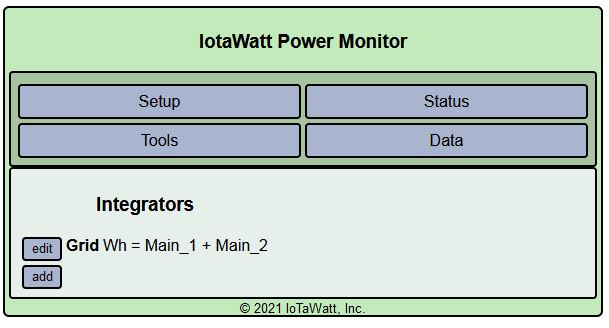
Please read the docs section about integrators here. Pay particular attention to the section about tracking solar import/export.
Your Graph+ plots Watts. I cant see the &end value, but it appears to be sometime later the same day. Apparently you have &group=all. That will yield the net imported Watts. Since your exports exceed the imports, the net is negative and your output makes that zero.
In the statistics tab of that plot, you might look at the Sum/Integral column for import and export. That will give you a preview of what the integrator will do.
That was it! I deleted the "max 0) and Imported immediately showed a figure. Thank you, Steve.
However (isn’t there always a “however”? ) now the Exported output is zero when queried. But the graph shows a non-zero plot for it (as well as the newly working Imported) . I guess I’ve learned that the Query API does not return values just because they appear on the graph – the graph is not a validation for the formulas.
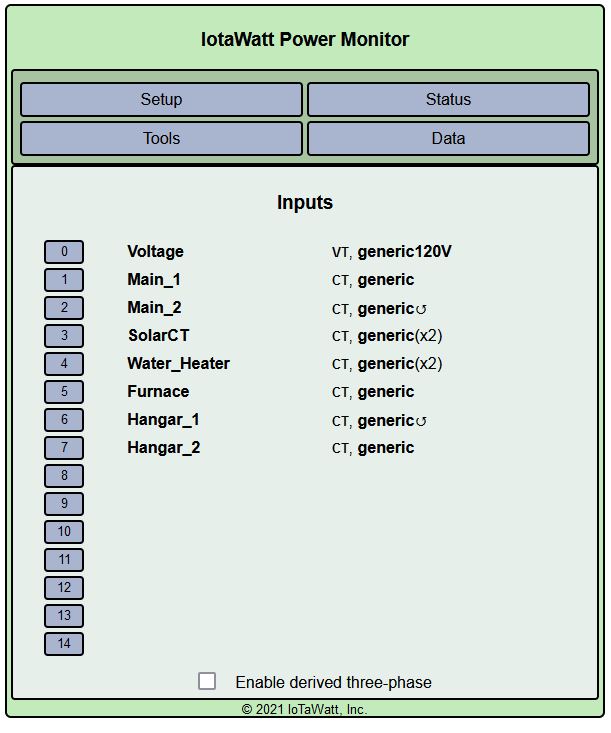
I guess I really don’t understand how to assign two different Outputs to the inputs such that one Output shows the positive-signed energy and the other shows negative (mains with a solar system giving both imported and exported).
Back to the docs and more head scratching. Thanks again, Steve.
About to hit “reply” and noticed a reply by @overeasy so will digest that before I do too much head scratching.
Thank you for that pointer and especially for implementing and documenting “Integrations”, Bob.
While I have your attention may I ask a couple more questions, please?
As you probably surmised from my earlier Outputs configuration posting, Solar feeds a subpanel named Hangar before it joins the main panel. Since I’d like to monitor the Hangar subpanel, wouldn’t it also be a good candidate for a Integrator too?
Are there any undocumented API calls for peak power and the time of first/last (solar) power of the day that would be more efficient than downloading a lot of 5-second interval data and processing it externally?
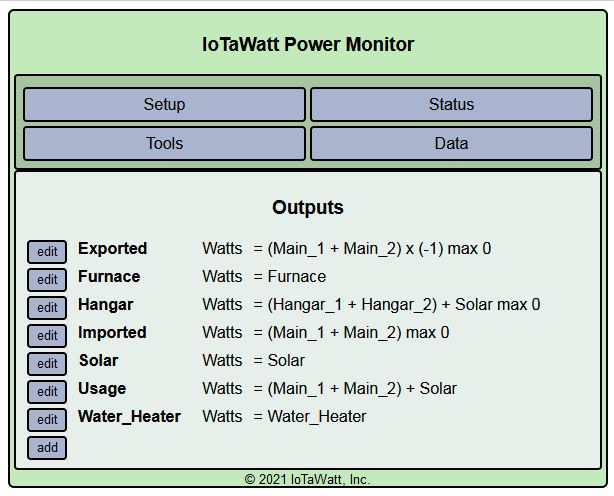
You should use integrators sparingly as they consume resources. You would use an integrator for the subpanel if you were interested in how much energy is imported to and exported from the sub-panel, but if you only care about how much energy is used by loads in the subpanel, you would treat it just like your Usage output on the main panel:
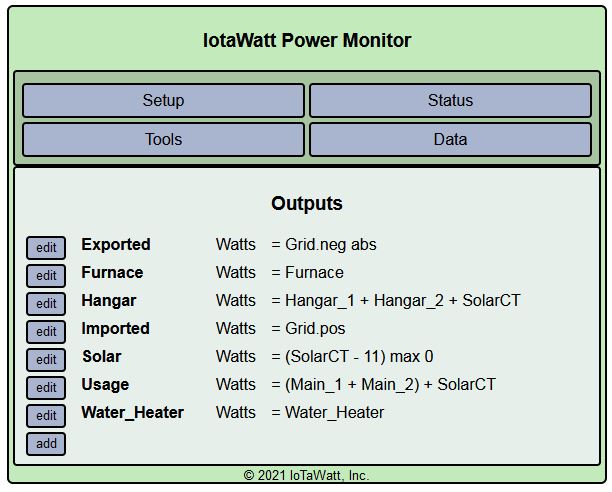
Hangar = Hangar_1 + Hangar_2 + Solar
But because energy can flow both ways (+/-) through the Hangar CTs, you would need to check “allow negative values” for those two CTs.
There is not. But downloading 17,280 5 second data points may not be necessary. An efficient query is 720 data points or less, which is 2 min intervals for a day. To find the first/last, you need only look at those to get your answer with 2 minute resolution or do a second query of the 24 datapoints in that two-minute interval to get 5 second resolution.
On the other hand, or for the maximum case, downloading a day’s worth of five-second samples takes about 3-5 seconds and is about a 20KB response. To search over a longer period of time I would recommend setting up an influxDB database. It has min/max query functions.
This is my case, so that’s what I did, and it works well.
Regarding an efficient query for peak/first/last: the 2-minute interval query seems like a good idea. However (there’s that word again ) I need to do this multiple times as the day’s solar generation progresses and the web page displaying this stuff is updated.
But I do store a daily summary (to include peak/first/last) in a MySQL database so I would only have to download, calculate, and store these numbers one time and only for “yesterday” and prior. I would not have those figures for “today” but I think I can live with that, especially since I have the wonderful Graph+ that shows me those things at a glance.
Once again I am indebted to you for your help.
BTW, until you pointed me to Integrators I had been using a PDF copy of the docs that I found on the web but I now realize it’s sadly outdated (release number 02_03_20). Wonder if a current PDF is available?
Even after implementing an integrator I’m still having an issue with incorrect results via an API call. Oddly enough, if I restart the IoTaWatt I receive the correct results – for a while. Then it’s back to the incorrect results where it remains frozen until I restart the box again.
but less than a minute later and after restarting IoTaWatt it returns:
20870, 4885, 16539, 9227
The third parameter, Exported power, was “frozen” for an unknown period of time. In the first returned results, it became obvious to me that Exported was bogus because Solar + Imported should equal Exported + Usage and it wasn’t so. After a restart they were approximately equal.
So I’m wondering if there’s something wrong with the format of my query. I’m interested in a single day’s results and I’ve entered today’s date with a timestamp for begin and end parameters but have tried others.
Incidentally, this is another pared down example and the full query has an additional 3 parameters that are always correct – no freezing. I believe Solar and Usage (the first and fourth in this example) are always correct too but I’m not 100% certain. The second parameter, Imported, was actually the original cause of this posting but I think it has been solid since using an integrator.
What appears to have happened is that the integrator was not working and after the restart it “caught up” to the current time. This is very unusual as once synchronized (up to date) it is maintained at the same time as the primary datalog. Maybe there’s a clue in the message log.
Is this something that is happening regularly or a single instance? Can I see your status display as well with the uploader (if any) and data logs tabs expanded?
If this freezes again, can you look at “data logs” in the status display and see if the Grid Log end at the same data and time as the current log? They should be advancing in lockstep.
Yes, “caught up” is an apt description. Nothing seems to be permanently missing.
This has been happening regularly – numerous times per day. I don’t always restart; sometimes its seems to fix itself the next day (when I query for the previous day’s data).
The Status display seems to always show the three logs in lockstep but I’ll specifically check next time it freezes.
I can get fooled by Imported and/or Exported not changing as changing solar generation and air conditioning usage can make them seem to be frozen but ironically I think it was frozen when I took this screenshot of the Status display a few minutes ago. Next time I’ll be more certain.
Looking back at the restarts since 7/31 in the log, the integrator was up to date at the time of the restart. So if there is a problem, it’s not the integrator stopping (didn’t think that was possible anyway).
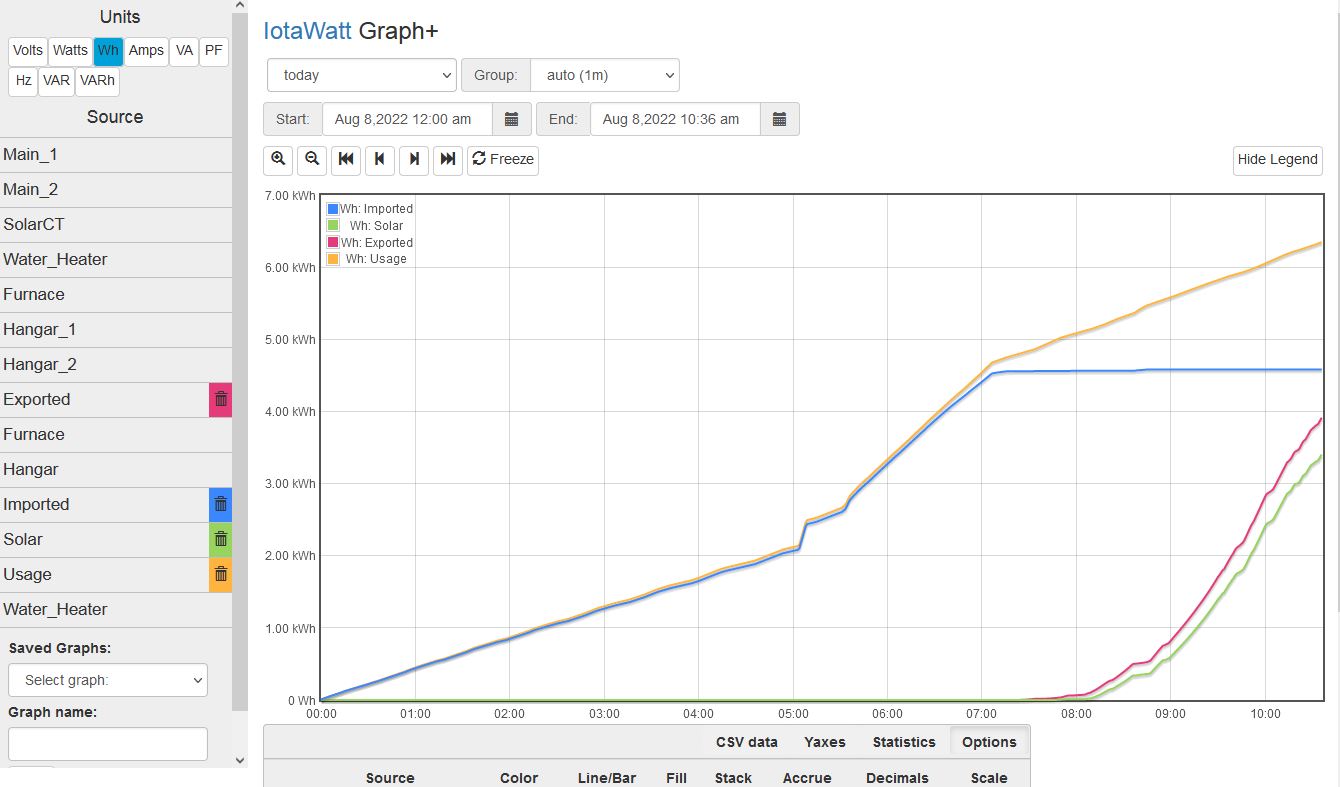
If it happens again that you think the query is returning low results, please run a Graph+ of the four entities before any restart. Be sure to select Wh and check the accrue box for each. Time period would be “today”.
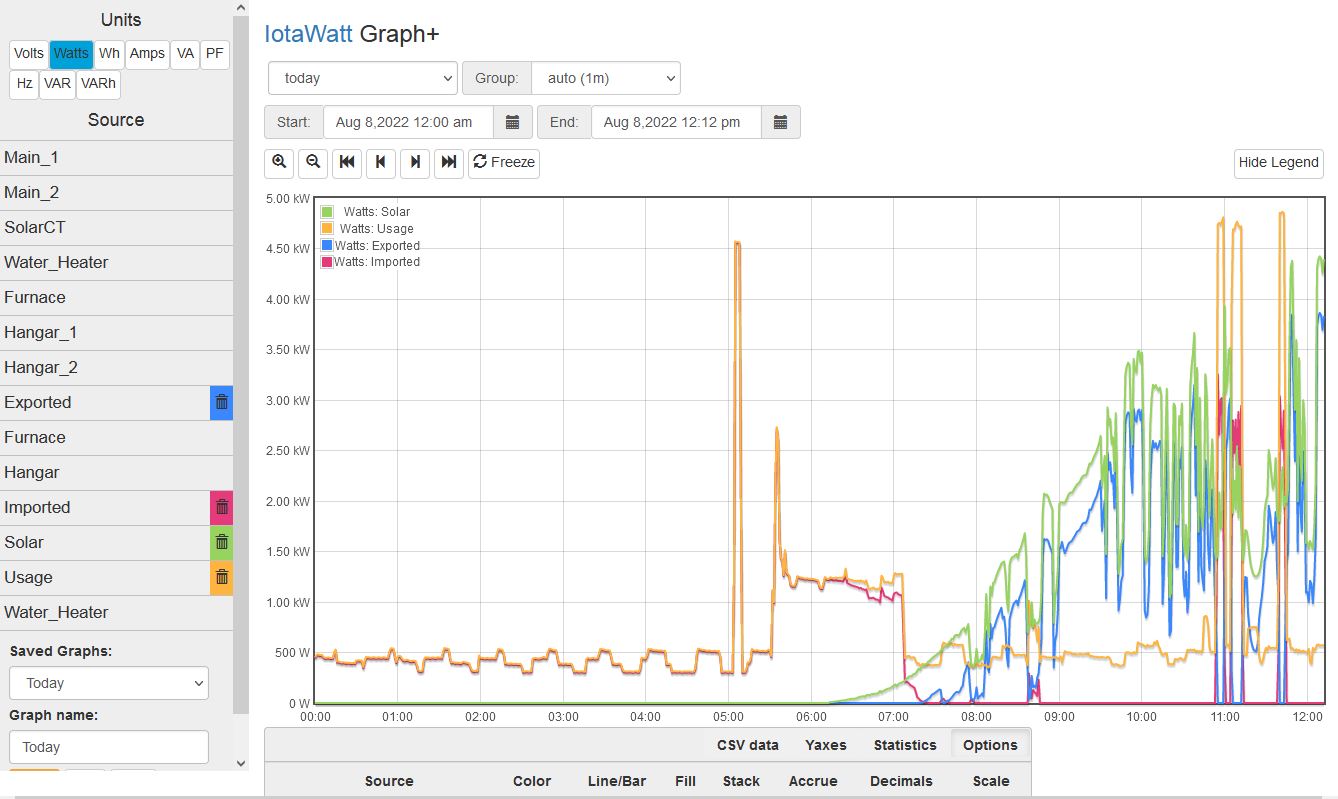
It was frozen when I checked it just now and the API query showed 0 for Exported. I ran a Graph+ (below) as you suggested and the act of doing that seems to have “unfrozen” it; the API now returns 3.8 kWh for Exported and it increases with subsequent queries as the solar generation increases during the late morning.
As you probably noticed in my earlier posts of the query API URL I’m using, I’ve punched a hole in my firewall for access to the IoTaWattI. If it’s of use to you, I would email you my login and password and you could access the IoTaWatt yourself.
I’m looking at the Graph+ and it appears that Exported increases steadily since about 7:45 this morning. What am I missing?
Update:
I see what’s going on. I’m dubious that simply running Graph+ “unfreezes” the query. I can reproduce the problem but running Graph+ does nothing to remedy the problem. Here’s what’s going on:
You want to retrieve the metrics for today but today is not finished yet. To get today before it is finished, you should use begin=d (start of current day) and end=s (current second). If you want the query to return one value for the entire time (as opposed to a series of intervals that you would need to add up), specify group=all.
I cannot defend the incorrect results with your query but will look into it. BTW/ if you want to get an entire day, you should specify something like begin=2022-08-08&end=2022-08-09. When you end at 2022-08-08T23:59:59 you will lose the last minute of the day.
Previously I hadn’t used Graph+ with “Wh” and the accrue box checked so I’m not very familiar with the energy graph, just power. But things seems pretty normal considering increasing solar generation with corresponding Exported as the day progresses but with some large Usage and reductions in Exported (and even some Imported) when the water heater kicked in.
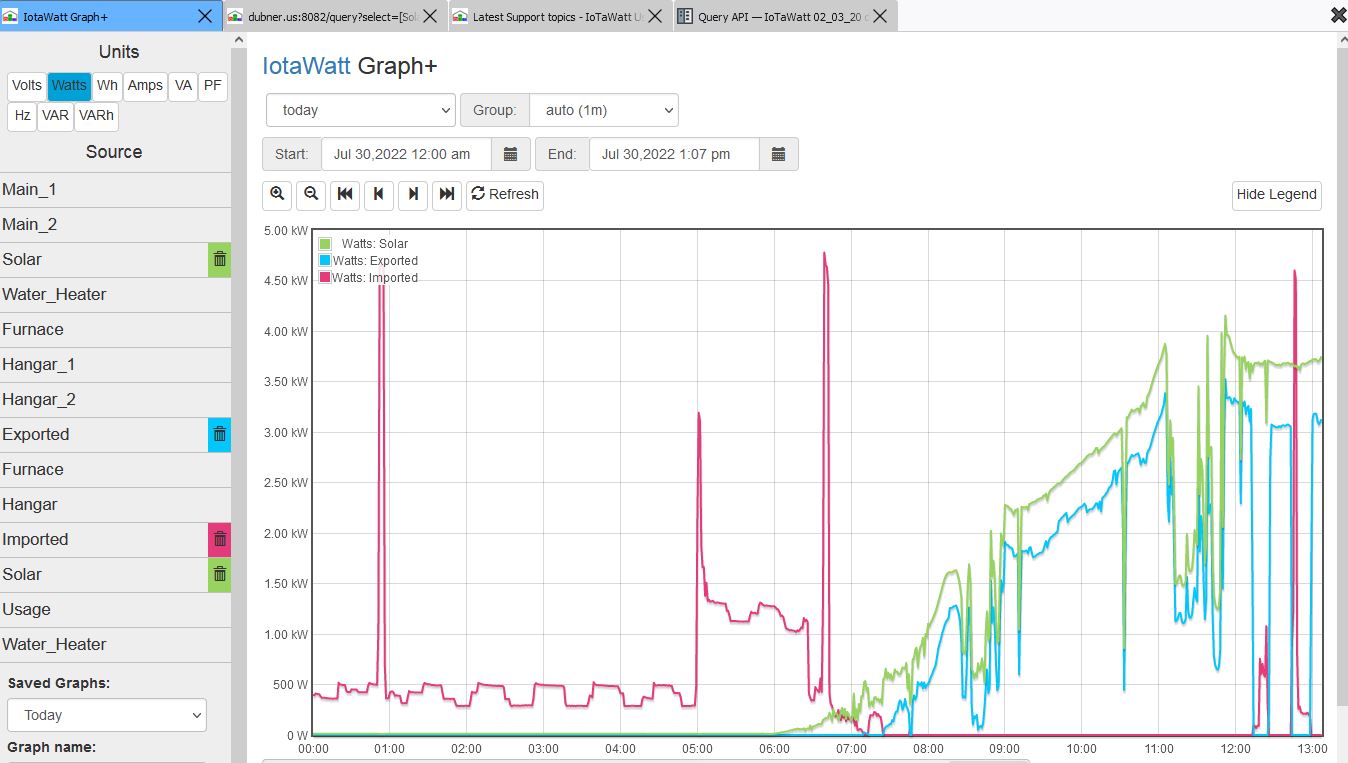
Here’s the Graph+ for power – pretty normal too IMO.
I do find it curious that the Exported energy trace is somewhat higher than the Solar energy trace on the “Wh” GraphPlus yet look correct on the “W” GraphPlus.
specify something like begin=2022-08-08&end=2022-08-09.
I do want the whole/not yet completed day and originally that’s what I used (although I hadn’t used group “all” – I think I used “d”). I changed it in an attempt to workaround the non-reported energy (now called “frozen”) and it seemed to work better but apparently it wasn’t a panacea. I’ll go back to something like begin=2022-08-08&end=2022-08-09 with a group of “all”.
I hear you about Graph+ and unfreezing … but … it was frozen again until I ran Graph+ to view what you were commenting about and now it’s no longer frozen.
So I’ll run the new query URL from here forward and stay away from Graph+ for the next day or two and see how it behaves.
As soon as I tried that it “unfroze” and it has been staying unfrozen although it’s too early to declare success.
Graph+ has nothing to do with the problem. It uses query to get it’s data and when you specify “today” it uses &begin=d&end=s
Could it be that Graph+ does a “good query” that unfreezes it after my “bad query” has locked it up?
But the ISO time format is preferable in my web application which shows daily data for the previous “n” days in a loop, not just “today”. With that format I can use the same dates in the MySQL database and IoTaWatt interchangeably – no translation to/from "d"s and “s”. Something like:
&begin=2022-08-08&end=2022-08-09&group=all
should work just as well, shouldn’t it? (Even though the end date is in the future, not “s”?)
I don’t know what I did to break things but perhaps it was the “group=d” mixed with ISO dates.
UPDATE: no, &begin=2022-08-08&end=2022-08-09&group=all freezes it too
and &begin=d&end=s&group=all unfreezes it again.
After 16 hours of flawless operation, I am ready to declare success. Thank you, Bob.
It is as I wrote in the “EDIT” at the bottom of the previous post, an ‘end’ time of “s” is required for a query out into the future. For a query in the past (i.e. up to the current time), an ISO ‘end’ date is fine. I’ve modified my application to comply with this and all is now copacetic.
I did not investigate ISO ‘begin’ times out into the future as that would be pointless. And while I’m using the ‘group’ of “all”, I don’t think there was anything wrong with a ‘group’ of “d”.
Onward! Thanks again, Bob – and especially for Integrators.

 ) now the Exported output is zero when queried. But the graph shows a non-zero plot for it (as well as the newly working Imported) . I guess I’ve learned that the Query API does not return values just because they appear on the graph – the graph is not a validation for the formulas.